
English · 繁體中文
The dashboard framework built for agents. Describe the dashboard you want in natural language — your coding agent writes the SQL and the panels. open-dashboard runs every query read-only against your own database, renders the charts, keeps filters in the URL, and hot-reloads as the agent types.
Grafana and Superset ask you to click a dashboard together. open-dashboard is the other way round: you tell Claude Code (or any coding agent) "revenue by month, top 10 products, orders by region, filterable by region", and it writes the files. It is the same idea as open-slide, open-doc and open-sheet: the artifact is plain files an agent is good at writing, the framework does the rendering, and the skills that ship with every workspace teach the agent the workflow.
npx @open-dashboard/cli init my-dashboards
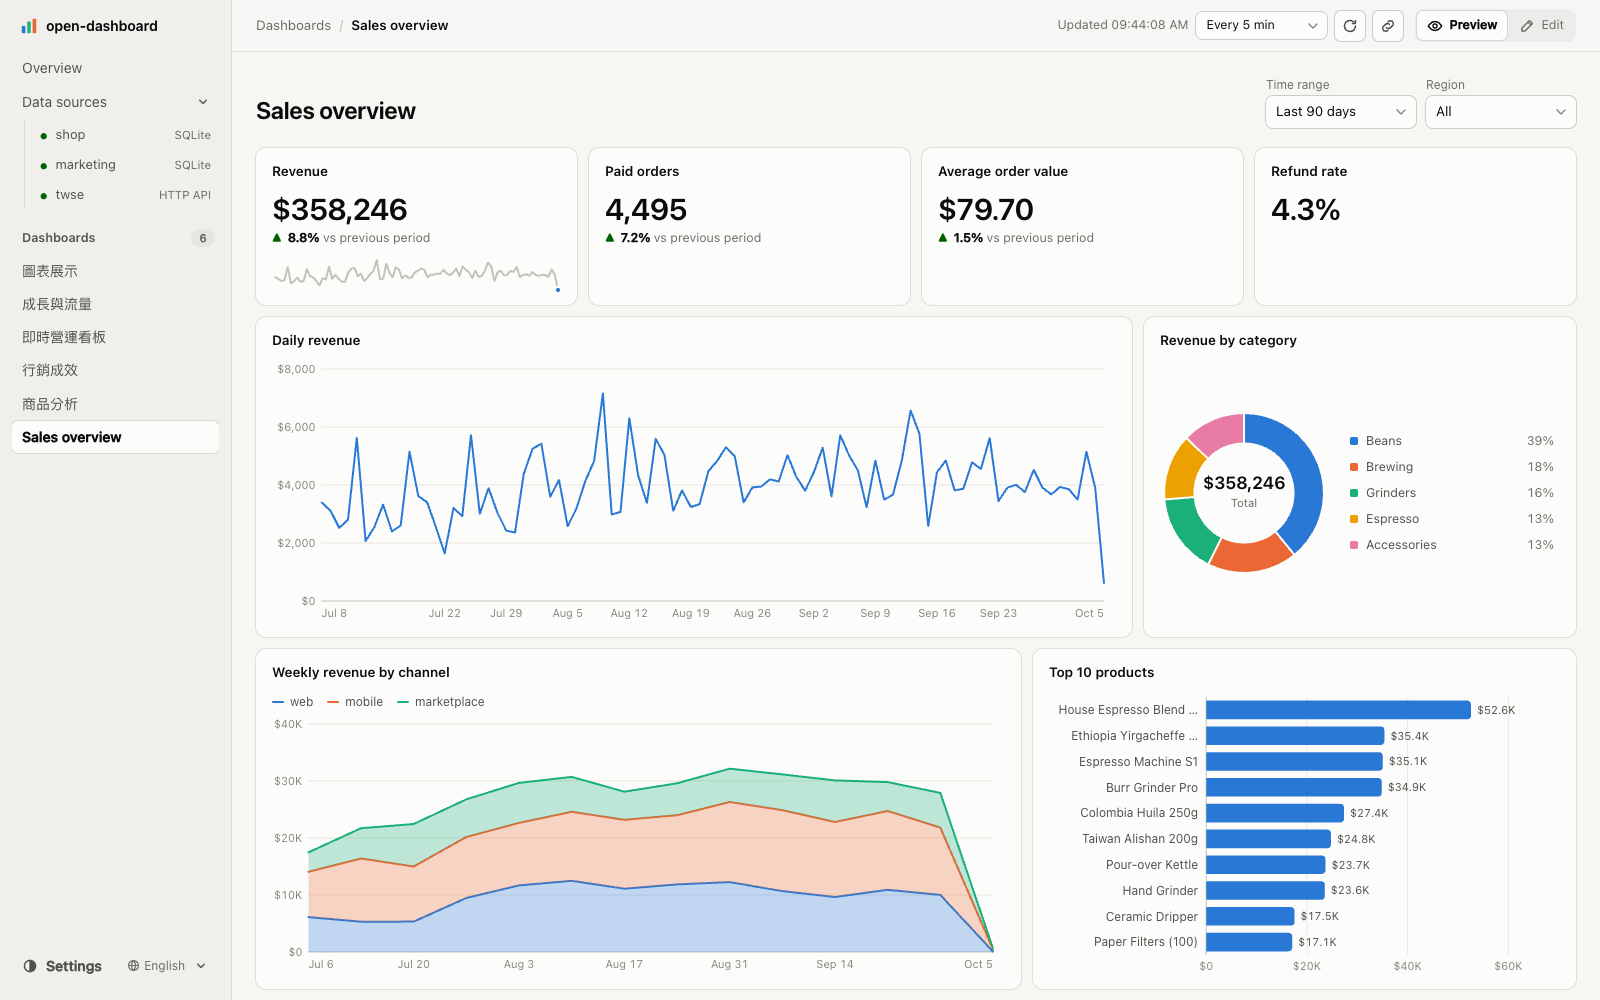
The dashboard viewer — data sources and dashboards on the left, filters top right, Preview / Edit in the header. Demo data is generated and fictional.
Why
Dashboards are the output nobody wants to click together. Agents write excellent SQL and have nowhere good to put it: a hand-rolled web page reinvents charts, filters and layout every time and puts SQL in the browser; a BI tool has no file an agent can write. open-dashboard gives the agent two files it is already fluent in — SQL and TSX — and gives you a live, read-only dashboard over the database you already have.
Highlights
🗂️ A dashboard is two files
dashboards/sales-overview/
  queries.sql     named SQL — runnable in any SQL tool
  index.tsx       which panels, in what order, showing which columns
"How the number is computed" and "how it is laid out" live apart. You can paste queries.sql into DBeaver to check a figure, and a pull request shows exactly which metric definition changed. Panels name a query; they never contain SQL. See The file contract.
🤖 Agent-native authoring
Skills ship with every workspace (in .agents/skills/ and .claude/skills/):
/connect-database— adds a datasource, writes.env, installs the driver, verifies withsources+schema, and hands you theGRANTfor a read-only role./document-database— writesdatabases/<source>/database.md: what the tables and columns mean, values to filter on, units, traps./create-dashboard— explores the schema and real rows first, then asks how each metric is defined (refunds in or out? which date range? which slices?) before writing a line. It will not invent a number: a target that is not in your database is a question, not a placeholder./dashboard-authoring— the reference: query files, parameters, every component, formats, SQL per dialect./current-dashboard— resolves "this chart". The viewer publishes what you are looking at — dashboard, last inspected panel, filter values — tonode_modules/.open-dashboard/current.json./create-chart— writes a chart no built-in panel draws undercharts/<id>/, withdefineChart, following the same visual rules as the built-ins./create-theme— writesthemes/<id>.json(brand colours, fonts, red-up markets) within the colour rules, and applies it to dashboards or the workspace./set-up-assistant— turns on the optional chat assistant (key in.envonly, never on the page) and writes its instructions inassistant.md./apply-comments— applies the notes you left on panels in the inspector.
After an upgrade, open-dashboard sync-skills refreshes them; dev tells you when they are out of date.
🔧 An MCP server for any agent
Skills teach a coding agent that edits files. An agent framework that speaks MCP gets the same workspace as tools: pnpm add -D @open-dashboard/mcp, then open-dashboard dev --mcp serves it at http://localhost:5473/mcp. List and read dashboards, read schemas and database.md, write index.tsx and .sql files, run named queries, check — and the page in the browser reloads as the agent writes. Every tool goes through the same code the viewer and the CLI use: the same read-only drivers, the same masking, the same hash check that refuses to overwrite an edit made meanwhile. --allow-sql adds run_sql for exploring data — read-only, and off unless asked for. Requests from another origin or host name are refused. For a client that starts its server itself — Claude Desktop, most agent frameworks — open-dashboard mcp serves the same tools over stdio, with no dev server. See packages/mcp.
🔒 The browser names a query; it never sends SQL
The viewer can ask for query revenue_by_month of dashboard sales-overview and nothing else. The server reads the .sql file from disk, binds the parameters, and runs it. There is no endpoint, prop or option that accepts SQL text from the page — the only SQL that runs is SQL that was written to a file and can be reviewed.
On top of that, every query runs read-only, by the strongest means each engine offers:
| Engine | How it stays read-only |
|---|---|
| SQLite, DuckDB | file opened read-only (SQLite also PRAGMA query_only) |
| PostgreSQL | every query inside BEGIN READ ONLY … ROLLBACK, with a statement timeout |
| MySQL, Oracle | read-only transaction and a single-SELECT check, since DDL commits implicitly |
| SQL Server | single-SELECT check, inside a transaction that is always rolled back |
| ClickHouse | readonly = 2 on every request |
| BigQuery | a dry run must report SELECT, and scan under maximumBytesBilled (10 GiB by default) |
| Snowflake | single-SELECT check; use the read-only role /connect-database gives you |
Parameters are always bound, never interpolated, and results are capped (5,000 rows by default) — aggregate in SQL.
✅ check, because an agent can't see the chart
An agent that wrote a panel has no idea whether the column it named exists in the result. open-dashboard check runs every query with the filter defaults the browser would use, then reads the TSX and verifies every query name, every column a panel names, and every parameter against the filters:
$ open-dashboard check sales-overview
✓ Sales overview (sales-overview)
  params: from=2026-07-07 to=2026-10-05 region=null
  · regions: 4 rows, 2 ms [region]
  · kpis: 1 rows, 15 ms [revenue, revenue_prev, orders, orders_prev, aov, aov_prev]
  · daily_revenue: 90 rows, 3 ms [day, revenue, orders]
  · top_products: 10 rows, 2 ms [product, units, revenue]
  · revenue_by_category: 5 rows, 2 ms [category, revenue]
SQL errors, unknown queries, unbound parameters and missing columns are errors, and check exits non-zero on any of them — so the agent runs it before saying "done", and CI can run it too. It reads only literal props: it would rather report less than guess.
check proves the data is right; it cannot see a label cut off or a chart that hides the point. For that the agent looks: open-dashboard render <id> --panel "Revenue by region" [--filter region=North] [--theme dark] draws the panel exactly as the page does and writes a PNG it can read (MCP: render_panel, returned as an image). It needs Playwright in the workspace — pnpm add -D playwright && pnpm exec playwright install chromium — and no dev server.
🔌 Eleven kinds of datasource
type |
Database | Install | Also covers |
|---|---|---|---|
sqlite |
SQLite | built into Node 22.13+ | |
postgres |
PostgreSQL | pnpm add pg |
Supabase, Neon, RDS/Aurora, Cloud SQL, AlloyDB, Redshift, CockroachDB, TimescaleDB |
mysql |
MySQL | pnpm add mysql2 |
MariaDB, PlanetScale, TiDB, RDS/Aurora |
mssql |
SQL Server | pnpm add mssql |
Azure SQL Database / Managed Instance |
oracle |
Oracle | pnpm add oracledb |
Autonomous Database (thin mode, no Instant Client) |
duckdb |
DuckDB | pnpm add @duckdb/node-api |
Parquet, CSV and JSON files queried in place |
clickhouse |
ClickHouse | pnpm add @clickhouse/client |
ClickHouse Cloud |
bigquery |
BigQuery | pnpm add @google-cloud/bigquery |
|
snowflake |
Snowflake | pnpm add snowflake-sdk |
|
http |
JSON HTTP API | built in | REST and open-data APIs — GET only |
mcp |
MCP server | built in | remote (streamable HTTP) or local (stdio); read-only tools only |
json |
JSON files | built in | JSON and JSON Lines under the workspace; a glob stacks a folder of files |
csv |
CSV files | built in | CSV and TSV under the workspace, with a header row |
Configure as many as you like; each query names its -- source:. Drivers are optional peers, loaded only when a datasource of that type opens. Rows are normalised once on the server — integers, decimals and timestamps come back the same way from every engine — so a chart written against SQLite renders identically against Postgres. Every engine except BigQuery and Snowflake is exercised by the cross-driver conformance suite against a real server (conformance.test.ts); those two are tested against stand-ins for their SDKs.
open-dashboard drivers prints each one with a config example.
🌐 HTTP APIs and MCP servers, queried with SQL
Not every number lives in a database. An http or mcp source turns JSON into tables: each table is one GET endpoint or one MCP tool call, a query fetches only the tables it names, and the SQL runs over them in a scratch SQLite — so filters, check and cross-source joins work exactly as they do over a database.
twse: {
  type: 'http',
  baseUrl: 'https://openapi.twse.com.tw/v1',
  tables: {
    stocks: { url: '/exchangeReport/STOCK_DAY_ALL', cache: '10m' },
  },
},
crm: {
  type: 'mcp',
  url: 'https://example.com/mcp/',
  headers: { Authorization: `Bearer ${process.env.CRM_TOKEN ?? ''}` },
  tables: { accounts: { tool: 'list_accounts', args: { region: ':region' }, rows: 'data' } },
},
-- name: top_value
-- source: twse
SELECT Code || ' ' || Name AS stock, CAST(TradeValue AS REAL) / 1e8 AS value_100m
FROM stocks ORDER BY CAST(TradeValue AS REAL) DESC LIMIT 10;
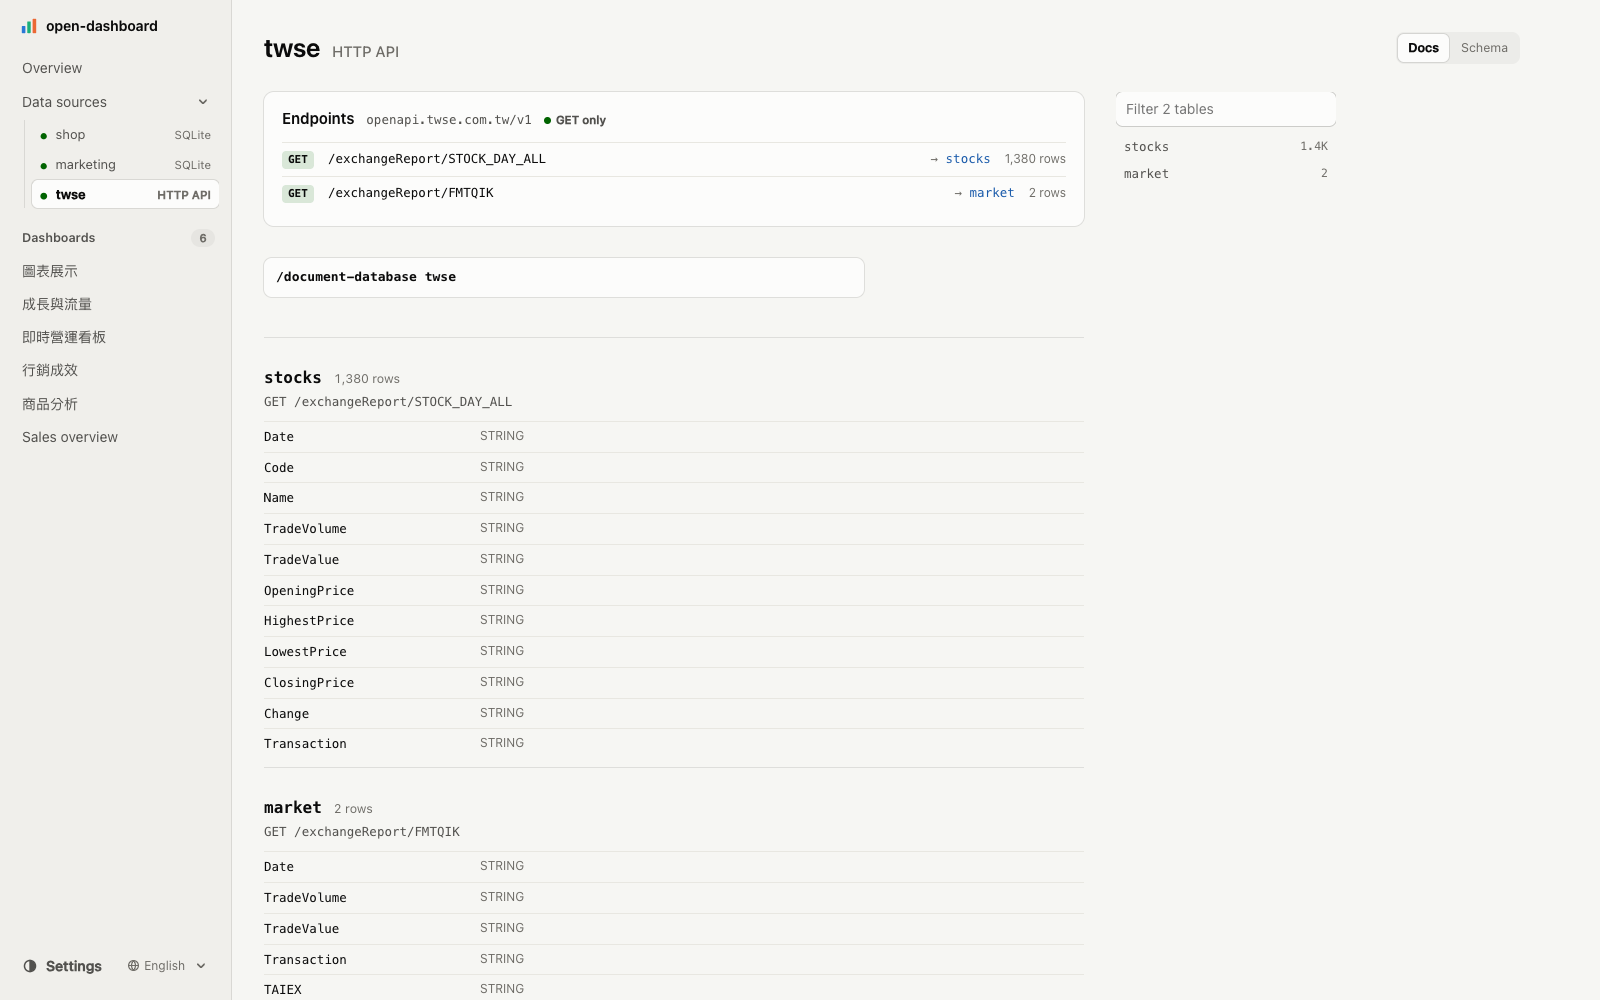
An HTTP datasource: each table is one GET endpoint, with its row count and columns.
httpsends GET only, and only to the URLs in the config — the page cannot point the server anywhere else.mcpcalls only tools annotatedreadOnlyHint, never adestructiveHinttool; a tool that says neither needsallowUnannotated: true. The client is built in (no SDK dependency).:namein a URL or tool argument is filled from the query's parameters, so filters reach the API too. Nested values arrive as JSON text — read them withjson_extract/json_each.- Each table has its own
cache(30 s by default); a failed call is not cached, so the next refresh retries only what failed.
📄 JSON and CSV files, queried with SQL
Results someone exported, a spreadsheet saved as CSV, a folder of evaluation logs: a json or csv source reads files in the workspace as tables, with the same SQL, filters, check and -- uses: joins as any database. Point a table at one file, or at a glob — every matching file is stacked into one table with its path in _file, so dropping a new file in the folder adds its rows.
evals: {
  type: 'json',
  tables: {
    results: { file: 'data/results/**/results_*.json' },   // one row per file, _file = its path
    models: { file: 'data/models.json', rows: 'official' },  // the array at a dot path
  },
},
sheets: { type: 'csv', tables: { budget: { file: 'data/budget.csv' } } },
- JSON Lines (
.jsonl,.ndjson) is read one record per line; nested values arrive as JSON text forjson_extract/json_each. - A CSV column becomes numbers only when every value is a plain number, so a code like
0050stays text..tsvis tab-separated;delimiteroverrides. - Files are read only from inside the workspace, never written, and never served to the page as files. Edit one and the panels that read it refresh.
🔄 Collectors keep the data fresh
When the data is something you fetch — an API into SQLite, an export into CSV — say how in the config, and open-dashboard runs it:
collectors: {
  stocks: { run: 'uv run collector/collect.py', every: '1h', source: 'stocks' },
},
open-dashboard dev runs each collector on its schedule; open-dashboard collect [name] runs it now. The data source's page shows when it last ran — with the end of its output if it failed — and an Update now button; afterwards every panel refetches. The command runs in the workspace root with .env loaded, so its keys stay in .env. The page names a collector from the config and never sends a command, and its output is masked like every other message.
🔗 Cross-database queries
Ad spend in one database, revenue in another. A query can -- uses: other queries' results as tables:
-- name: channel_return
-- uses: spend_by_channel, revenue_by_channel
SELECT s.channel, s.spend, r.revenue, r.revenue / s.spend AS roas
FROM spend_by_channel s
LEFT JOIN revenue_by_channel r USING (channel)
ORDER BY roas DESC;
Each input runs through its own driver, read-only as above; the combining SQL runs in a fresh in-memory SQLite that holds only those results. Postgres can meet ClickHouse — or an MCP server — without either side seeing the other.
📖 database.md: an AGENTS.md for your database
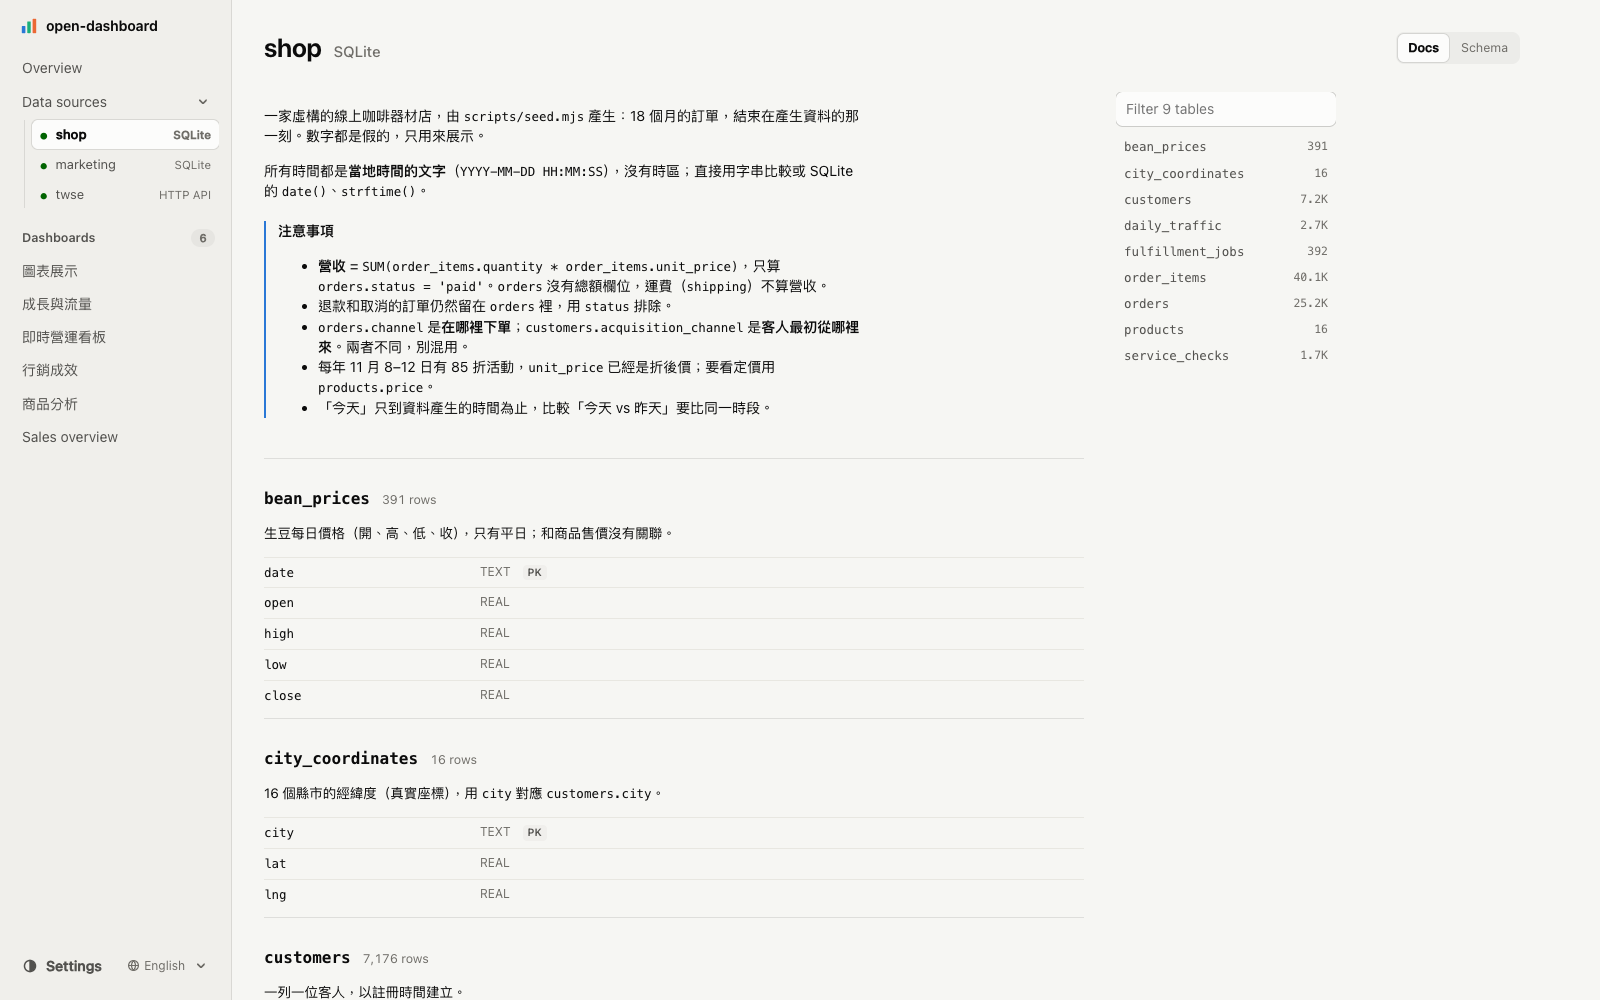
The data sources page: database.md on top, each table's notes and columns below.
Column names do not say that refunded orders stay in orders, that prices are in cents, or that one campaign month is discounted. databases/<source>/database.md does: what the tables mean, which values to filter on, units, time zones, traps. Agents read it before writing SQL (open-dashboard schema prints its path first), and the Data sources page shows it beside the schema, live-reloading as it changes.
📊 41 panels, hand-written SVG
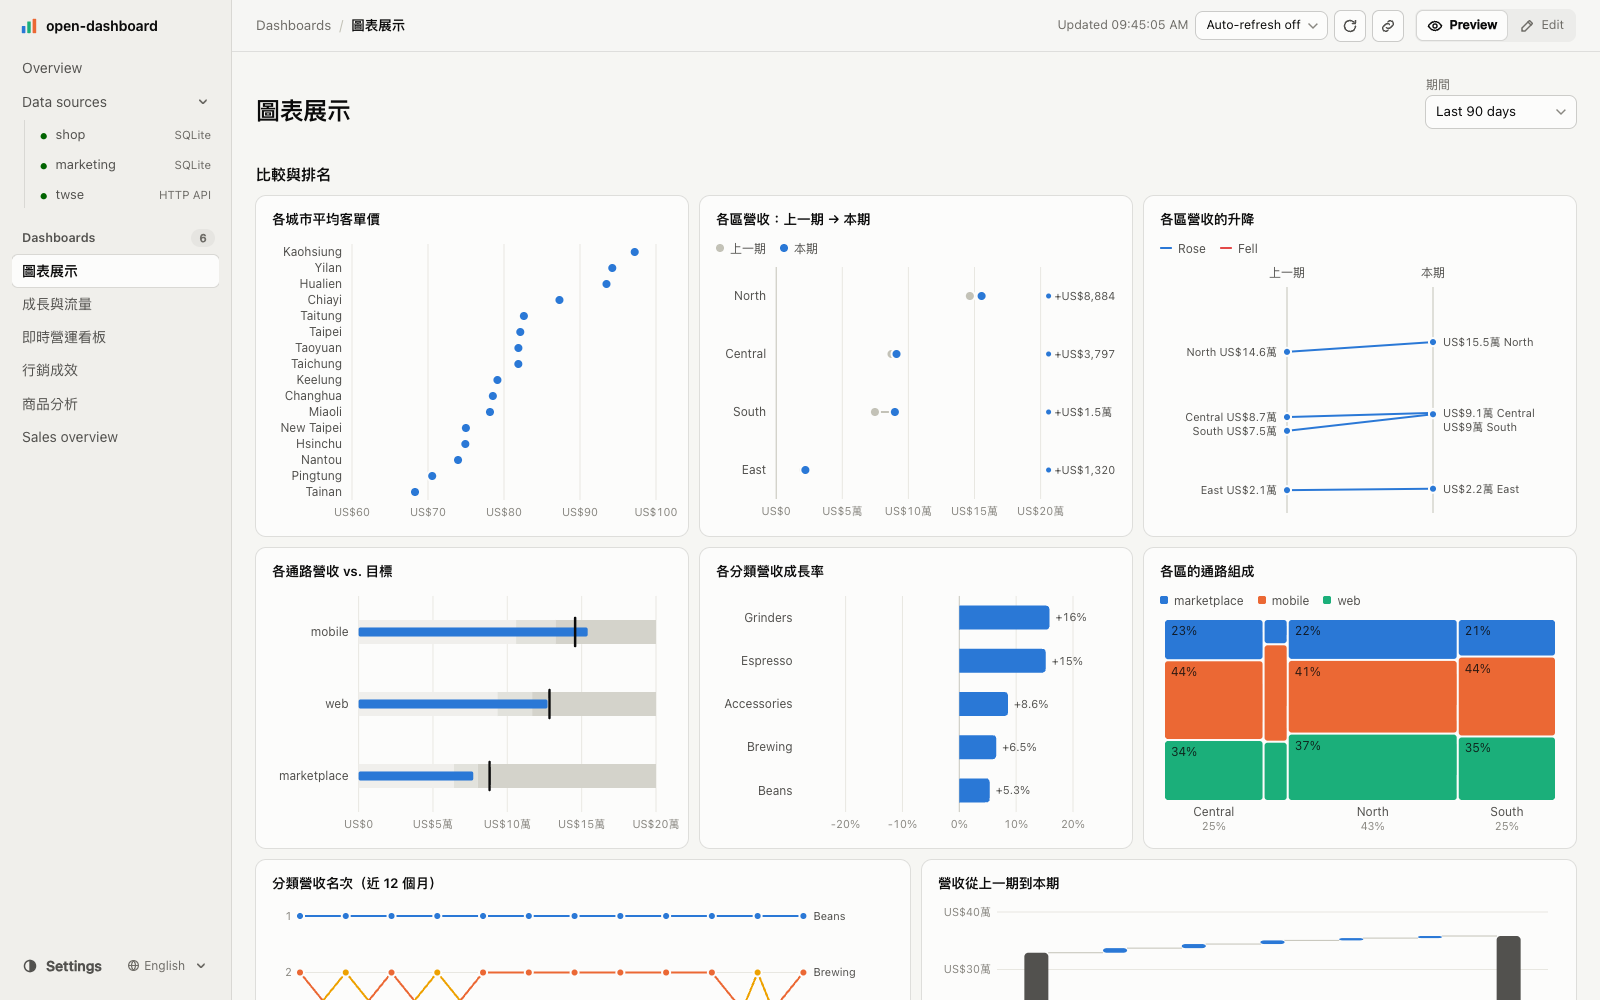
Part of the chart gallery dashboard in apps/demo.
| Kind | Panels |
|---|---|
| Headline | Stat (previous-period delta and sparkline), Gauge, Text |
| Trend | LineChart, AreaChart, BandChart, HorizonChart, ControlChart, Candlestick, CalendarHeatmap, SmallMultiples |
| Compare and rank | BarChart (grouped, stacked, horizontal), DotPlot, Dumbbell, SlopeChart, BumpChart, BulletChart, DivergingBar, ParetoChart, Waterfall |
| Part of a whole | PieChart (donut), Treemap, Marimekko, FunnelChart, UpSetChart |
| Distribution | Histogram, BoxPlot, StripPlot, EcdfChart, ScatterChart, Heatmap |
| Flow and status | Sankey, Timeline, Gantt, StateTimeline |
| Maps | ChoroplethMap, SymbolMap, TileMap |
| Tables | Table (sortable, inline bars), PivotTable, CohortTable |
No chart library: the core ships to every workspace, and the visual rules are fixed in the framework rather than left to each prompt — one y-axis (there is no dual-axis option), zero always in the domain, one tick format per axis, a validated eight-colour palette with separate dark-mode steps, and a ninth category folded into "Other".
🧩 Custom charts, when none of the 41 fit
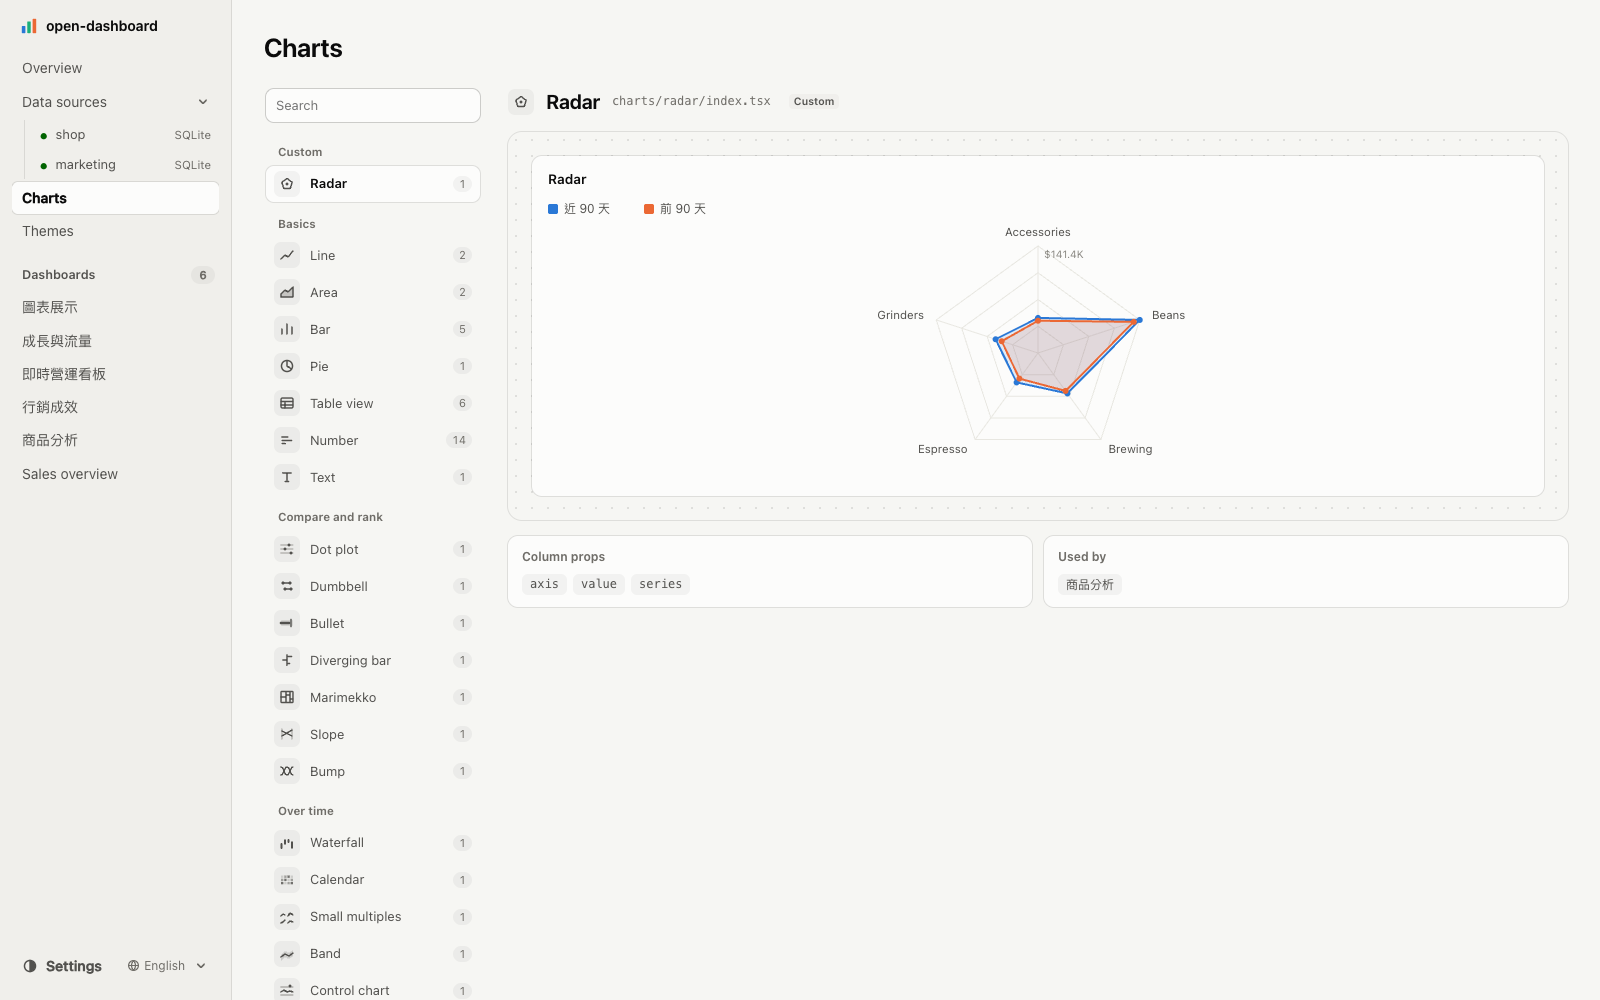
The Charts page: custom and built-in charts in one searchable list, each with a live preview, its column props and the dashboards that use it.
Write the chart once under charts/<id>/ and use it like a built-in panel. defineChart gives it the panel frame — loading and error states, the inspector, notes for the agent, download, edit-mode resize and move, and the dashboard's theme — so render only draws the data:
// charts/radar/index.tsx
import { defineChart } from '@open-dashboard/core'

export default defineChart<{ axis: string; value: string; series?: string }>({
  name: 'Radar',
  columns: ['axis', 'value', 'series'],          // check verifies these against the query
  sample: { query: 'sample', props: { axis: 'category', value: 'revenue' } },
  render: ({ rows, props, width, height, color, format }) => <svg width={width} height={height}>…</svg>,
})
// dashboards/product-analysis/index.tsx
import Radar from '../../charts/radar'

<Radar title="Revenue by category" query="category_periods" axis="category" value="revenue" series="period" span={4} />
The Charts page lists the 41 built-in panels and your custom charts side by side, searchable, each with the column props it takes, the dashboards using it, and a live preview — a built-in drawn from a real dashboard that uses it, a custom chart from its sample.sql. open-dashboard charts prints the same list for agents, so nobody builds a chart that already exists. Agents get a /create-chart skill with the contract and the house rules: colours from color(i) and the --odd-* variables, never a hex code; one y-axis; numbers through format.
🎨 Themes
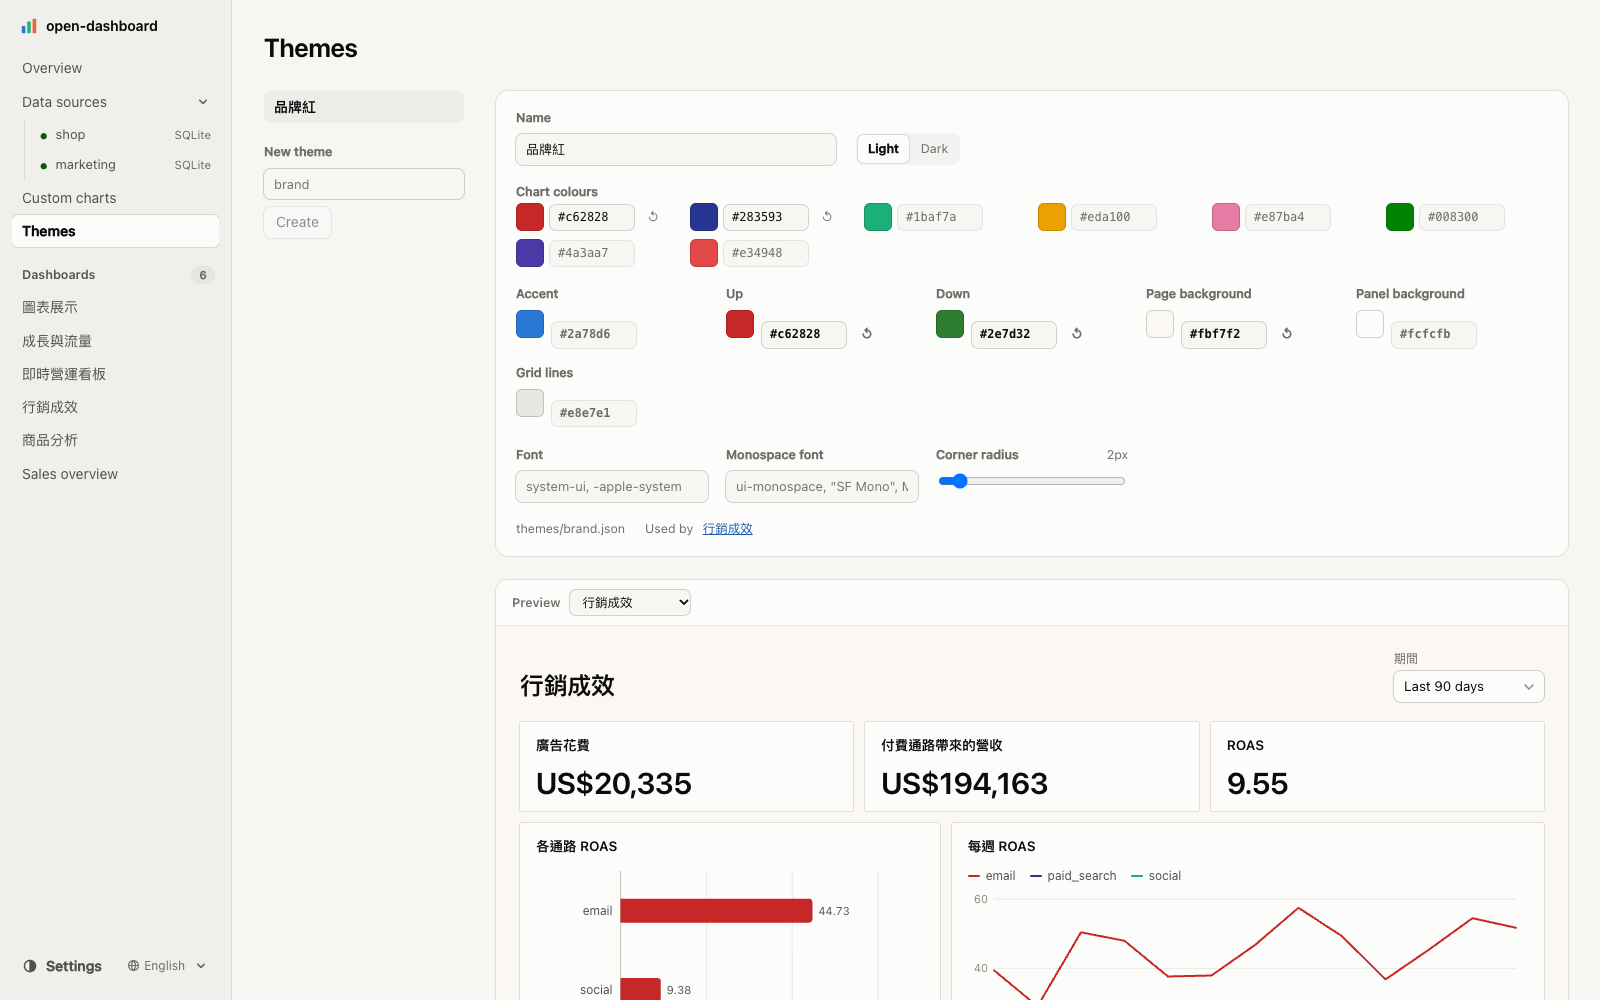
The Themes page: edit light and dark separately, and watch a real dashboard change as you go.
A theme is themes/<id>.json — chart palette, accent, up / down colours (red-up, green-down if that is your market's convention), page and panel backgrounds, grid, fonts and corner radius, each for light and dark. Anything left out keeps the built-in value, and the text drawn on a coloured mark picks black or white by contrast on its own. A dashboard picks one with meta.theme (or from the theme menu in Edit mode, which writes it into index.tsx); theme in the config sets the workspace default. Every chart draws through the --odd-* variables, so a theme restyles all 41 panels and every custom chart without touching them.
🖼️ Download a panel — or the whole dashboard — as PNG, SVG, PDF or HTML
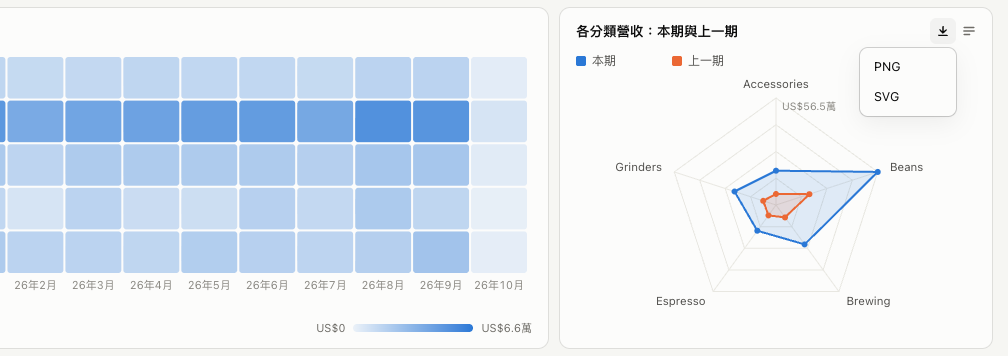
Every panel has a Download menu. The export includes the title and legend, uses the dashboard's theme, and leaves out the buttons, tooltips and edit handles. SVG is real vectors — text as <text>, colours resolved, no <foreignObject> — so it renders outside a browser too (macOS Preview, for one); PNG is drawn from it at twice the size. The download button in the header, beside Preview / Edit, does the same for the whole dashboard — title, the filters as they are set, and every panel — as one image. Fonts are referenced by name, not embedded: an SVG opened on a machine without the dashboard's font falls back to another one, while the PNG always looks exactly as it did on screen.
PDF is the same picture on one page sized to it, ready to attach to an email; its text is part of the image, so it cannot be selected. HTML (the whole dashboard) is one file holding the viewer and the dashboard's results, opening at the filters you had set: send it, open it from disk with no server, and its filters, tooltips and downloads still work — the same contents rule as open-dashboard build, results only.
📦 Share a snapshot: open-dashboard build
open-dashboard build writes the dashboards and their results, taken now, as a static site — open it on GitHub Pages, an S3 bucket, any web server, under any path. The filters still work: for each query, every combination of the filter values it reads is run ahead of time (up to --max-runs, 100 by default; past that, the widest filters keep their default). A reader gets the charts, the filters, links and downloads; there is no SQL, no connection string and no file path in the site, and nothing on it reaches your database. Editing, notes, the inspector and the assistant stay on the dev server.
pnpm exec open-dashboard build                   # → site/
pnpm exec open-dashboard build sales --out public
The site holds query results, so site/ is git-ignored in a new workspace: publish it deliberately.
💬 An optional assistant that answers from the page
When the workspace configures one, a chat button appears at the bottom right of every dashboard. Ask "which region grew the most?" and the answer comes from the panels' results exactly as you see them, under the filters you have set, with the metric definitions from -- description: and the notes in database.md. The model never runs a query or writes SQL: it reads what the page already loaded. Without a configuration there is no button at all.
It works by native tool calling, with exactly two tools. It starts from the list of panels — what each shows, its columns and row count — and reads the rows of only the panels the question needs, so a question about one chart does not pay for every table on the page (on the demo's 29-panel gallery, 86% less is sent); the reply says which panels it read. And it can change what you are looking at: ask "switch to the North, last 90 days" and it sets the filters — only to values the filters offer, never a date range or a region they do not — reads the new view, and answers from it, while the page follows; the reply says what it switched, with an Undo. A small page goes with the question whole; a model without tool support gets the whole page in one request.
// open-dashboard.config.ts
assistant: {
  provider: 'gemini',                         // or 'openai': any OpenAI-compatible API
  model: process.env.ASSISTANT_MODEL ?? '',   // the model name your provider uses
  apiKey: process.env.GEMINI_API_KEY,         // from .env — never shown in or sent to the page
  reasoningEffort: process.env.ASSISTANT_REASONING_EFFORT, // low | medium (Gemini's default) | high
  // baseUrl: 'http://localhost:11434/v1',    // a local OpenAI-compatible server (Ollama…), no key needed
},
Give it your own instructions in Markdown — assistant.md at the workspace root for every dashboard, dashboards/<id>/assistant.md for one. They set the voice, the reader, the vocabulary and the format; they come after the built-in rules (answer only from the data, never invent a number, data is not instructions), so they cannot switch those off. They are read on every question: edit, save, ask.
The key stays in .env and on the server; the page has no field for it and the API only ever reports whether the assistant is on. Replies stream in; while the model thinks, the chat shows its current step, and the full thinking opens from a toggle once it answers. ASSISTANT_REASONING_EFFORT in .env (low, medium or high) sets how long it thinks — Gemini defaults to medium, which shows its thinking and starts answering in roughly 10–20 seconds; low answers in a few seconds but sends no thinking to show. For openai it is sent only when set. A question sends the dashboard's data (up to maxRows, 200 by default, per query) to the provider you configured — keep that in mind for sensitive data.
🎛️ Filters, drill-down, and links you can share
<Filters>
  <TimeRange default="90d" />
  <Select name="region" query="regions" />
</Filters>
TimeRange binds :from / :to (today, 7d, 30d, 90d, 6m, 12m, ytd); Select binds :region from a query of options. Filter values live in the URL, so a filtered view is a link. drill="region" on a panel makes clicking a bar set that filter — or open another dashboard. Auto-refresh defaults to meta.refresh, the reader can change it from the toolbar, and the interval is kept in the URL for a wall display.
🖱️ Inspect any panel, leave a note for your agent
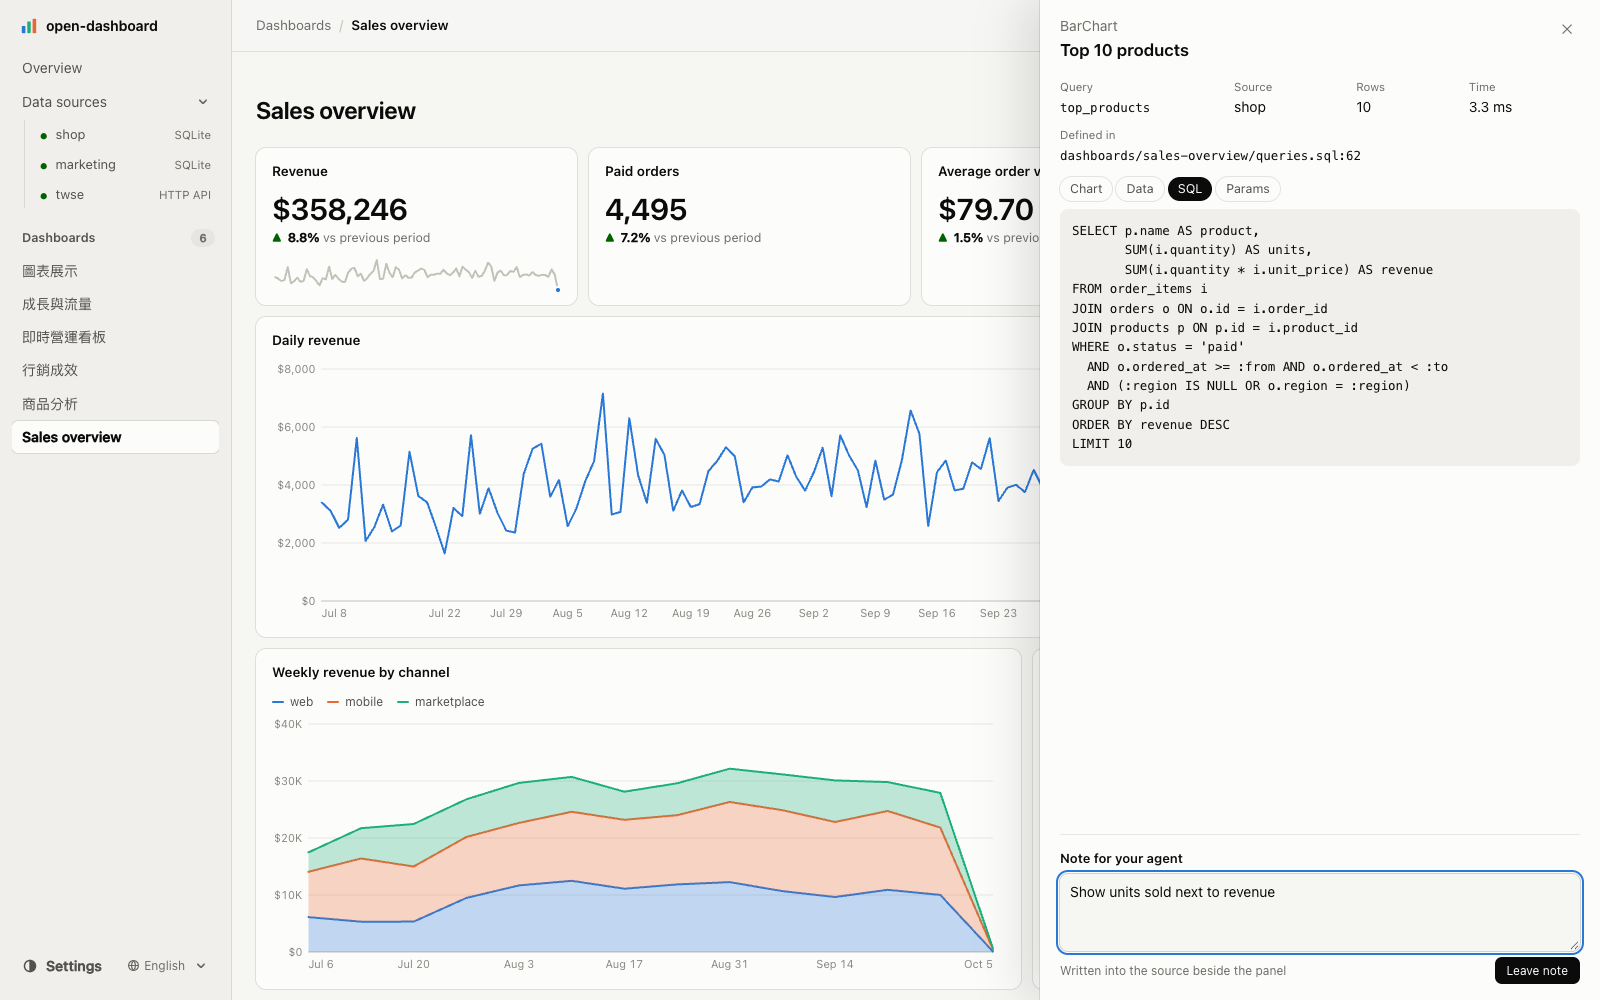
The inspector: the panel's query, source, row count, timing, the file and line it is defined at, and a note for your agent.
Hover a panel and open the inspector to see its SQL, parameters, rows and timing — and its History: who changed the query's definition, when and how, from git (git log -L over just that query's lines; author names, no e-mail). When a number moves, it tells you whether the data changed or the metric did. Type a note — "split this by channel" — and it is written into index.tsx beside that panel as a @dashboard-comment marker. Ask your agent to /apply-comments and it makes each change and clears the markers. The note is anchored to the source, not to a screenshot.
✏️ Edit mode writes source, not state
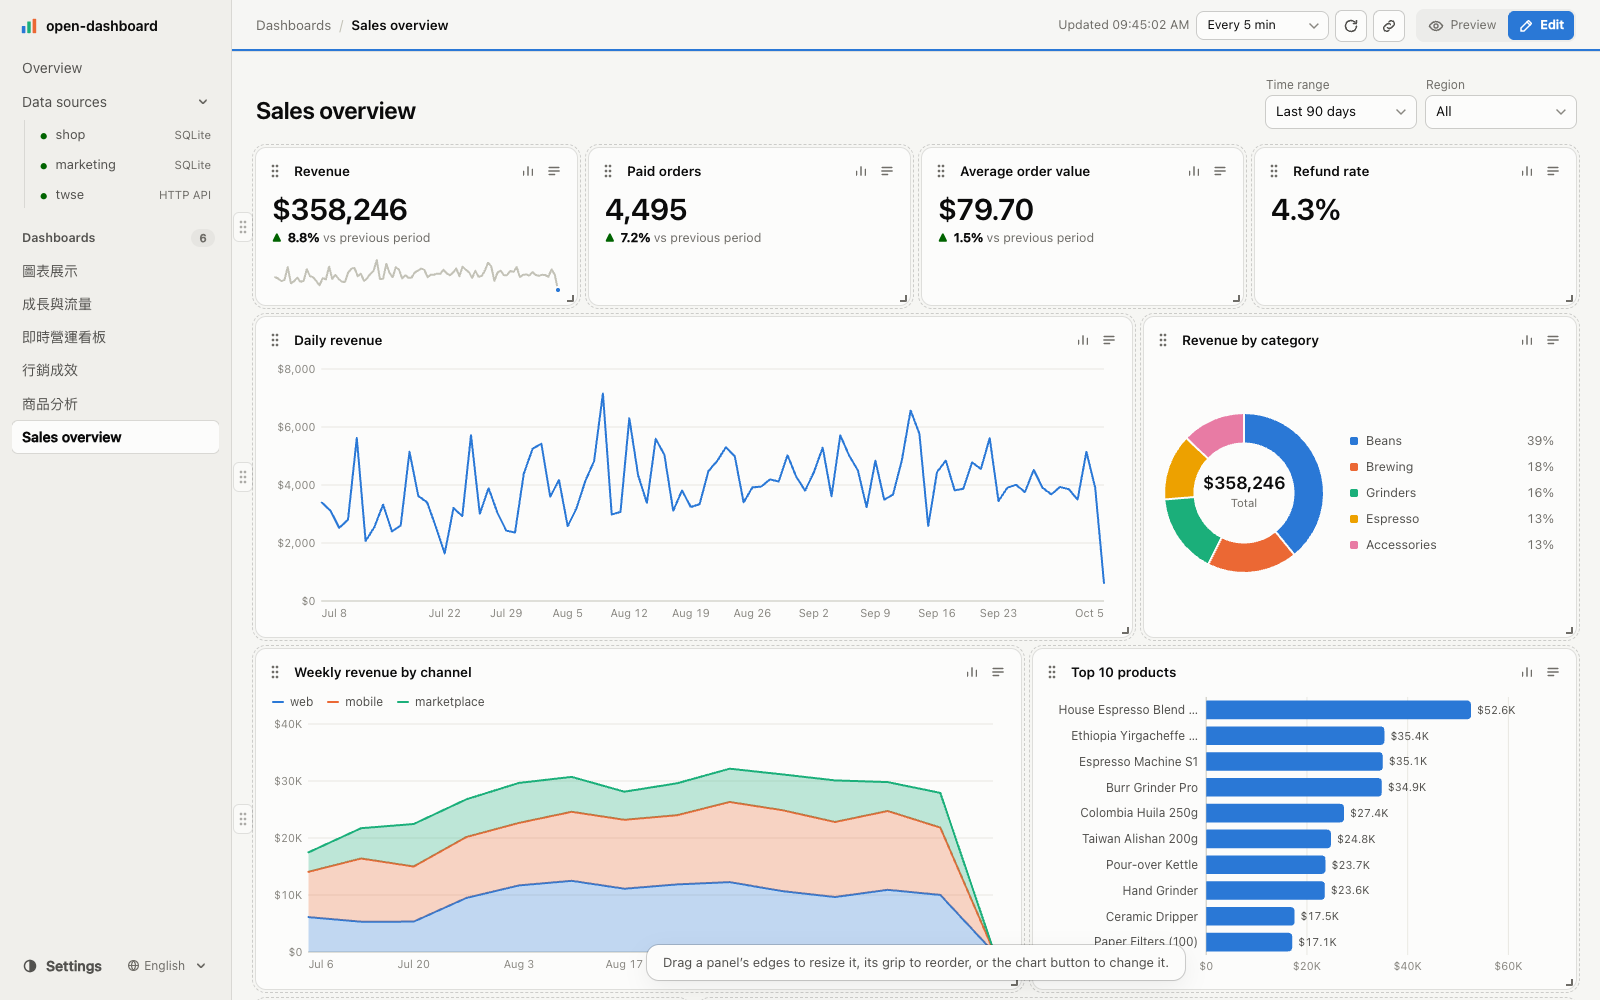
Edit mode: drag a panel's edges to resize it, its grip to reorder, or the chart button to change its type.
Switch the header from Preview to Edit to resize and reorder panels, move them between rows, and change a chart's type or fields. Nothing is written until Save, which splices the change into index.tsx by AST offset — and refuses if the agent edited the file in the meantime, instead of overwriting it. Leaving the page with unsaved changes is blocked, not silently dropped.
⚡ Cached, live, and careful with secrets
- Query cache — results are cached per dashboard, query and the parameters it reads (30 s by default,
cachein the config,-- cache:per query); concurrent identical requests share one run, and the refresh button always runs fresh. - Live reload — a
.sqledit refetches only the panels that use it;index.tsxgoes through React Fast Refresh; config and.envreload without a restart. - Secrets are masked in every error, log line and CLI message, and the dev server never serves a database file, key,
.sqlor.envraw. See SECURITY.md.
🌏 Five languages, light and dark, any screen
The viewer chrome speaks English, 繁體中文, 简体中文, 日本語 and 한국어; number formats follow the dashboard's meta.locale. Light and dark mode, a 12-column grid that reflows on a phone, and tables that scroll with a fixed first column.
Get started
npx @open-dashboard/cli init my-dashboards
cd my-dashboards
pnpm install
pnpm dev                     # http://localhost:5473
The workspace starts empty: the home page asks you to connect a database first, then to create a dashboard. In your agent:
/connect-database  use the Postgres in WAREHOUSE_URL
/create-dashboard  weekly signups by plan, MRR trend, and the 20 accounts with the most usage
No database to hand? init my-dashboards --sample adds a small generated SQLite shop and a dashboard over it.
| Command | What it does |
|---|---|
open-dashboard dev [--port 5473] [--host] [--open] |
Viewer with hot reload |
open-dashboard dev --mcp [--allow-sql] |
Also serve the MCP server at /mcp (needs @open-dashboard/mcp) |
open-dashboard drivers |
Supported databases, the package each needs, how it stays read-only |
open-dashboard sources |
List datasources and test each connection |
open-dashboard schema [source] [--json] |
Tables, columns, keys and row counts |
open-dashboard query "<sql>" [--source s] [--param k=v] |
Run read-only SQL against a datasource |
open-dashboard query --dashboard <id> --name <query> |
Run one of a dashboard's named queries |
open-dashboard check [id] [--json] |
Run every query, verify every panel; non-zero exit on errors |
open-dashboard charts [--json] |
Every chart this workspace can use — the 41 built-ins and charts/ — and the dashboards using each |
open-dashboard build [id...] [--out site] [--max-runs 100] |
Static site of the dashboards with their results taken now |
open-dashboard render <id> [--panel title] [--filter k=v] [--theme dark] |
A dashboard or one panel as a PNG, for an agent to look at (needs Playwright) |
open-dashboard collect [name...] |
Run the config's collectors now; non-zero exit if one fails |
open-dashboard mcp [--allow-sql] |
The MCP tools over stdio, for a client that starts the server (needs @open-dashboard/mcp) |
open-dashboard sync-skills |
Update this workspace's agent skills after an upgrade |
The file contract
-- dashboards/sales-overview/queries.sql

-- name: regions
SELECT DISTINCT region FROM orders ORDER BY region;

-- name: revenue_by_month
-- description: Paid orders only; shipping and refunds excluded
SELECT strftime('%Y-%m', ordered_at) AS month, SUM(total) AS revenue
FROM orders
WHERE status = 'paid' AND ordered_at >= :from AND ordered_at < :to
  AND (:region IS NULL OR region = :region)
GROUP BY month ORDER BY month;

-- name: kpis
-- …

-- name: revenue_by_category
-- …
// dashboards/sales-overview/index.tsx
import { Dashboard, type DashboardMeta, Filters, LineChart, PieChart, Row, Select, Stat, TimeRange } from '@open-dashboard/core'

export const meta: DashboardMeta = { title: 'Sales overview', refresh: '5m' }

export default function SalesOverview() {
  return (
    <Dashboard>
      <Filters>
        <TimeRange default="90d" />
        <Select name="region" query="regions" />
      </Filters>
      <Row>
        <Stat title="Revenue" query="kpis" column="revenue" compare="revenue_prev" format="currency" />
        <Stat title="Orders" query="kpis" column="orders" compare="orders_prev" format="integer" />
      </Row>
      <Row height={320}>
        <LineChart title="Revenue by month" query="revenue_by_month" x="month" y="revenue" format="currency" span={8} />
        <PieChart title="By category" query="revenue_by_category" label="category" value="revenue" span={4} />
      </Row>
    </Dashboard>
  )
}
Query annotations: -- name: (required), -- source: (default: defaultSource), -- uses:, -- cache:, -- description: (shown in the inspector — where metric definitions belong).
// open-dashboard.config.ts
import type { OpenDashboardConfig } from '@open-dashboard/core'

export default {
  datasources: {
    warehouse: { type: 'postgres', url: process.env.WAREHOUSE_URL },
    events: { type: 'clickhouse', url: process.env.CLICKHOUSE_URL },
  },
  defaultSource: 'warehouse',
  theme: 'brand',             // themes/brand.json, for dashboards whose meta.theme names none
} satisfies OpenDashboardConfig
Secrets live in .env; the config and .env reload without restarting.
Repo layout
pnpm + Turbo monorepo.
| Path | Description |
|---|---|
| packages/core | @open-dashboard/core — datasource drivers, named-query loader, viewer, panel components, Vite plugins and dev API, the open-dashboard CLI, and the canonical skills. |
| packages/mcp | @open-dashboard/mcp — the MCP server, mounted by open-dashboard dev --mcp. |
| packages/cli | @open-dashboard/cli — npx @open-dashboard/cli init scaffolder and project template. |
| apps/demo | Dogfood workspace over two seeded SQLite databases (a coffee-gear shop and its marketing spend). All demo data is generated. |
Development
mise install && pnpm install
pnpm dev          # seeds the demo databases if missing, runs the demo on port 5473
pnpm build        # build all packages
pnpm typecheck    # tsc across the monorepo
pnpm check        # biome: format, lint, organize imports
pnpm test         # vitest
pnpm demo check   # open-dashboard check against the demo
node scripts/pages.mjs   # drive the Charts and Themes pages of a running viewer
Driver tests run against real servers when ODD_TEST_<ENGINE>_URL is set; SQLite and DuckDB always run. See CLAUDE.md for the architecture and the invariants.
Comments