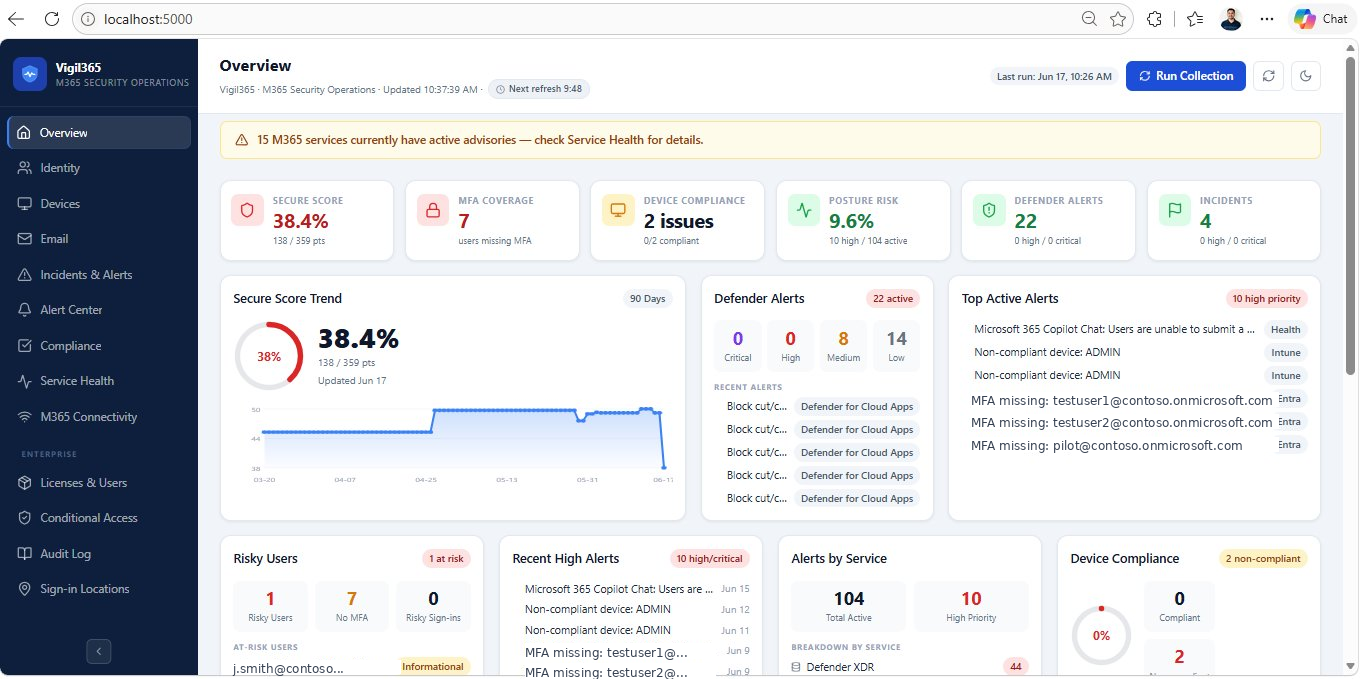
A self-hosted, real-time Microsoft 365 security monitoring dashboard that aggregates alerts from Defender XDR, Entra ID Protection, Intune, Exchange Online, Compliance, and more — all in one place.
No third-party SaaS required. Runs entirely on your own Windows host using Microsoft Graph API.
---
Features
Pages & Monitoring Coverage
| Page | What it monitors |
|---|---|
| Overview | Secure Score trend, KPI tiles, recent alerts, risky users, compliance summary, alert policy status |
| Identity | Risky users, risky sign-ins, risk detections, MFA coverage, PIM assignments, MDI alerts, foreign sign-ins |
| Devices | Intune compliance, non-compliant devices, stale devices, MDE endpoint alerts |
| MDO protection alerts by category (malware, phish, spam), threat breakdown | |
| Incidents & Alerts | Unified Defender XDR incidents + alerts, severity KPI tiles, date-range filter |
| Compliance | DLP alerts, MCAS alerts, IRM insider risk alerts, attack simulations |
| Alert Center | Custom alert policies, policy templates, triggered alert history, acknowledge/resolve workflow |
| Service Health | M365 service advisories and incidents, per-service health status |
| M365 Connectivity | Sign-in health, connectivity issues |
| Licenses & Users | License SKU breakdown, inactive users, expiring licenses |
| Conditional Access | Policy list, state breakdown (Enabled/Report-only/Disabled), per-policy detail |
| Audit Log | Unified audit log with category filter, actor/target detail |
| Sign-in Locations | Geographic sign-in map, success/failure breakdown, country drill-down |
Enterprise Features
- Alert Policy Engine — define custom policies (MFA drop, risky user spike, device breach) with thresholds; auto-evaluates against live data and tracks triggered alerts in browser localStorage
- 9 Pre-built Alert Templates — one-click templates for common security scenarios
- Detail Modals — click any alert, user, device, or policy to see all available fields and a direct "View in M365 Portal →" deep link
- Search, Filter, Sort, Export — every page has full-text search, dropdown filters, sortable columns, and CSV export
- Saved Filter Presets — save and reload custom filter combinations per page (localStorage)
- Dark Mode — full dark/light theme toggle, persisted across sessions
- Collapsible Sidebar — icon-only collapsed mode with hover tooltips
- Toast Notifications — on export, preset save, policy actions
- Sticky Filter Bars — filter controls stay visible while scrolling long lists
- Responsive Layout — collapses to single-column below 900px
Stack
| Layer | Technology |
|---|---|
| Backend | ASP.NET Core 8 Minimal API |
| Frontend | React 18 + TypeScript + Vite |
| Auth | Microsoft Graph — Client Credentials (app-only) |
| Scheduler | .NET BackgroundService — every 15 minutes |
| Storage | SQL Server Express (alerts + collection runs) |
| Icons | lucide-react |
Prerequisites
- Windows host (Windows 10/11 or Windows Server 2019+)
- .NET 8 SDK or ASP.NET Core 8 Hosting Bundle
- SQL Server Express (free)
- Node.js 20+
Microsoft Entra App Registration
Create the app
- Go to Entra admin center → App registrations → New registration
- Name it (e.g.
M365SecurityDashboard) - Select Accounts in this organizational directory only
- No redirect URI needed
- Click Register
- Note the Tenant ID and Application (client) ID
- Go to Certificates & secrets → New client secret — note the secret value immediately
Required API permissions (Application, not Delegated)
Grant admin consent for all of these:
| Permission | Used for |
|---|---|
SecurityAlert.Read.All |
Defender XDR alerts |
SecurityIncident.Read.All |
Defender XDR incidents |
IdentityRiskyUser.Read.All |
Entra ID risky users |
IdentityRiskEvent.Read.All |
Risk detections |
AuditLog.Read.All |
Sign-in logs, audit logs |
Reports.Read.All |
MFA registration, auth methods |
DeviceManagementManagedDevices.Read.All |
Intune devices |
ServiceHealth.Read.All |
M365 service health |
Policy.Read.All |
Conditional Access policies |
Directory.Read.All |
Users, groups, PIM |
PrivilegedAccess.Read.AzureAD |
PIM assignments |
ThreatHunting.Read.All |
Advanced hunting / MDI |
UserAuthenticationMethod.Read.All |
MFA method details |
Some features (IRM, Attack Simulation, Identity Health) require additional Purview/Defender licensing in your tenant. The dashboard gracefully shows a permission error card for unavailable features.
Setup
1. Clone and configure secrets
git clone https://github.com/YOUR_ORG/m365-security-dashboard.git
cd m365-security-dashboard

cd src\M365SecurityDashboard.Api
dotnet user-secrets init
dotnet user-secrets set "Graph:TenantId"     "YOUR_TENANT_ID"
dotnet user-secrets set "Graph:ClientId"     "YOUR_CLIENT_ID"
dotnet user-secrets set "Graph:ClientSecret" "YOUR_CLIENT_SECRET"
Never put real credentials in
appsettings.json— use User Secrets for development and environment variables orappsettings.Production.json(gitignored) for production.
2. Set up the database
# Option A: let the API auto-create on first run (requires db-create rights)
# Option B: pre-create manually
sqlcmd -S .\SQLEXPRESS -E -i .\database\schema.sql
3. Build the frontend
cd src\m365-security-dashboard-client
npm install
npm run build
Copy-Item -Recurse -Force .\dist\* ..\M365SecurityDashboard.Api\wwwroot\
4. Run the API
cd src\M365SecurityDashboard.Api
$env:ASPNETCORE_ENVIRONMENT = "Development"
dotnet run
Development (hot-reload)
Run both simultaneously:
# Terminal 1 — backend
cd src\M365SecurityDashboard.Api
$env:ASPNETCORE_ENVIRONMENT = "Development"
dotnet watch run

# Terminal 2 — frontend
cd src\m365-security-dashboard-client
npm run dev
Frontend dev server: http://localhost:5173 (proxies API calls to backend)
Production Deployment (Windows Service)
# 1. Build frontend
cd src\m365-security-dashboard-client
npm install && npm run build
Copy-Item -Recurse -Force .\dist\* ..\M365SecurityDashboard.Api\wwwroot\

# 2. Publish API
cd ..\M365SecurityDashboard.Api
dotnet publish -c Release -o C:\Apps\M365SecurityDashboard

# 3. Create appsettings.Production.json in publish folder
# (see template below — this file is gitignored)

# 4. Install as Windows Service
sc.exe create M365SecurityDashboard `
  binPath= "C:\Apps\M365SecurityDashboard\M365SecurityDashboard.Api.exe --environment Production --urls http://localhost:8080" `
  start= auto
sc.exe start M365SecurityDashboard
appsettings.Production.json template (create this file manually, never commit it):
{
  "ConnectionStrings": {
    "DefaultConnection": "Server=.\\SQLEXPRESS;Database=M365SecurityDashboard;Trusted_Connection=True;Encrypt=False"
  },
  "Graph": {
    "TenantId": "YOUR_TENANT_ID",
    "ClientId": "YOUR_CLIENT_ID",
    "ClientSecret": "YOUR_CLIENT_SECRET",
    "CollectionIntervalMinutes": 15,
    "DevicesNotCheckedInDays": 7,
    "SignInLookbackHours": 24
  }
}
API Reference
| Method | Endpoint | Description |
|---|---|---|
GET |
/api/dashboard/overview |
Aggregated overview data |
GET |
/api/dashboard/identity |
Identity & MFA data |
GET |
/api/dashboard/devices |
Intune device compliance |
GET |
/api/dashboard/email |
MDO email alerts |
GET |
/api/dashboard/compliance |
DLP/MCAS/IRM alerts |
GET |
/api/dashboard/incidents |
Defender XDR incidents |
GET |
/api/dashboard/mdi-alerts |
Microsoft Defender for Identity alerts |
GET |
/api/dashboard/mcas-alerts |
Defender for Cloud Apps alerts |
GET |
/api/dashboard/insider-risk |
Insider Risk Management alerts |
GET |
/api/dashboard/risk-detections |
Entra ID risk detections |
GET |
/api/dashboard/identity-health |
Identity health issues |
GET |
/api/dashboard/attack-simulation |
Attack simulation results |
GET |
/api/dashboard/service-health |
M365 service health |
GET |
/api/dashboard/licenses |
License SKU usage |
GET |
/api/dashboard/conditional-access |
CA policies |
GET |
/api/dashboard/audit-log |
Unified audit log |
GET |
/api/dashboard/sign-ins |
Sign-in locations |
POST |
/api/collector/run |
Trigger manual data collection |
GET |
/api/collector/runs |
Collection run history |
Security & Maturity
Read this before relying on Vigil365. This is an open-source read-only visibility aggregator, currently beta. It surfaces signals that already exist across your Microsoft 365 admin centers in one place. It is not a replacement for native Microsoft security tooling (Defender XDR, Entra ID Protection, Purview), and it does not make security decisions or change configuration for you. Treat its output as a convenience view, verify findings in the source portal before acting, and do your own review of the code before deploying it in a sensitive environment.
What is in scope by design
- Read-only, least privilege. Every Graph permission requested is
*.Read.All. The app cannot modify users, devices, policies, or tenant settings even if the host is compromised. - No remediation automation. "View in M365 Portal →" links only deep-link you to the correct blade. The app never tells you what to change and never makes changes — remediation stays in Microsoft's tooling where it belongs.
- No inbound exposure by default. The API binds to
localhost. Remote access requires you to deliberately open a firewall port (and you should front it with TLS + auth if you do). - App-only client-credentials flow via MSAL (
Azure.Identity). Standard Microsoft auth, not a homegrown scheme. All Graph traffic is HTTPS/TLS.
How credentials and secrets are handled
- The Graph client secret is never committed to source. Use .NET User Secrets (dev) or
appsettings.Production.json/ environment variables (prod, both gitignored). - Notification secrets stored in the database (SMTP password, Teams/Slack & generic webhook URLs) are encrypted at rest with the Windows Data Protection API (DPAPI), machine scope — a leaked database row cannot be decrypted on another machine. Secrets are decrypted only in memory at send time and the SMTP password is never returned by the API.
- Recommended: use certificate-based authentication instead of a client secret for production (planned/optional). A non-exportable certificate in the Windows cert store removes the plaintext shared secret entirely. (Not yet wired into the app — track this in Issues.)
Host hardening checklist (your responsibility)
The security of this app is only as good as the box it runs on. Before production use:
- Run on a dedicated, patched, hardened Windows host — not a shared workstation or a machine that handles untrusted input
- Run the service under a dedicated low-privilege service account, not an admin or your own login
- Enable BitLocker / full-disk encryption so the database and secrets are protected at rest
- Keep the host off the public internet; access the dashboard over the LAN/VPN only
- If you must expose it, put it behind a reverse proxy with TLS and authentication
- Ensure the host has endpoint protection and is monitored — a compromised host can read tokens in memory while the app runs
- Rotate the Graph secret/certificate on a schedule and immediately if the host is ever suspected compromised
- Restrict who can read
appsettings.Production.jsonand the SQL database with NTFS/SQL permissions
Operational resilience
- Rate limiting is handled automatically (429
Retry-Afterrespected). - A failed individual Graph source does not stop the whole collection run; each card degrades independently.
Found a security issue? See SECURITY.md — please report privately, not in a public issue.
Comments