Open-source, AI-driven penetration testing. Point it at a target you control, and a fleet of agents will recon, hypothesize, exploit, and report — autonomously.
🌐 Hosted version: fenneclabs.ai — managed runner, team features, persistent jobs. Join the waitlist there if you'd rather not self-host.
Authorized testing only. Fennec is built to assist security testing against systems you own or have explicit written permission to assess. Don't point it at anything else.
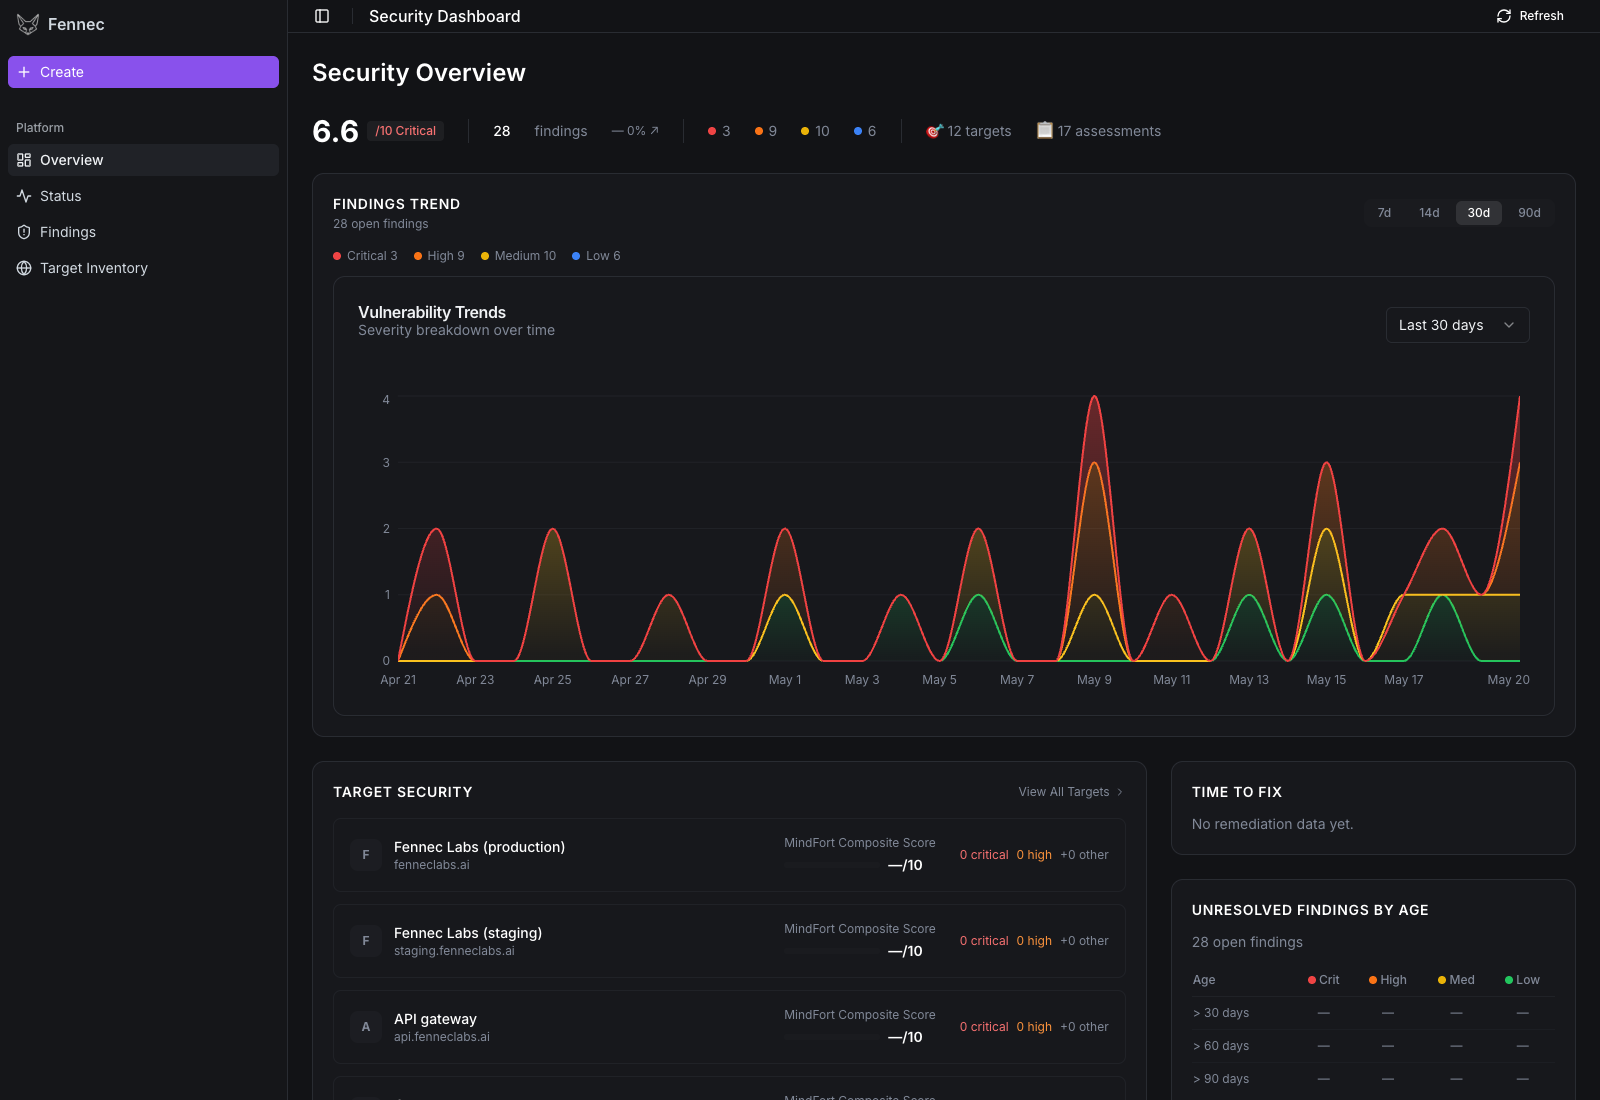
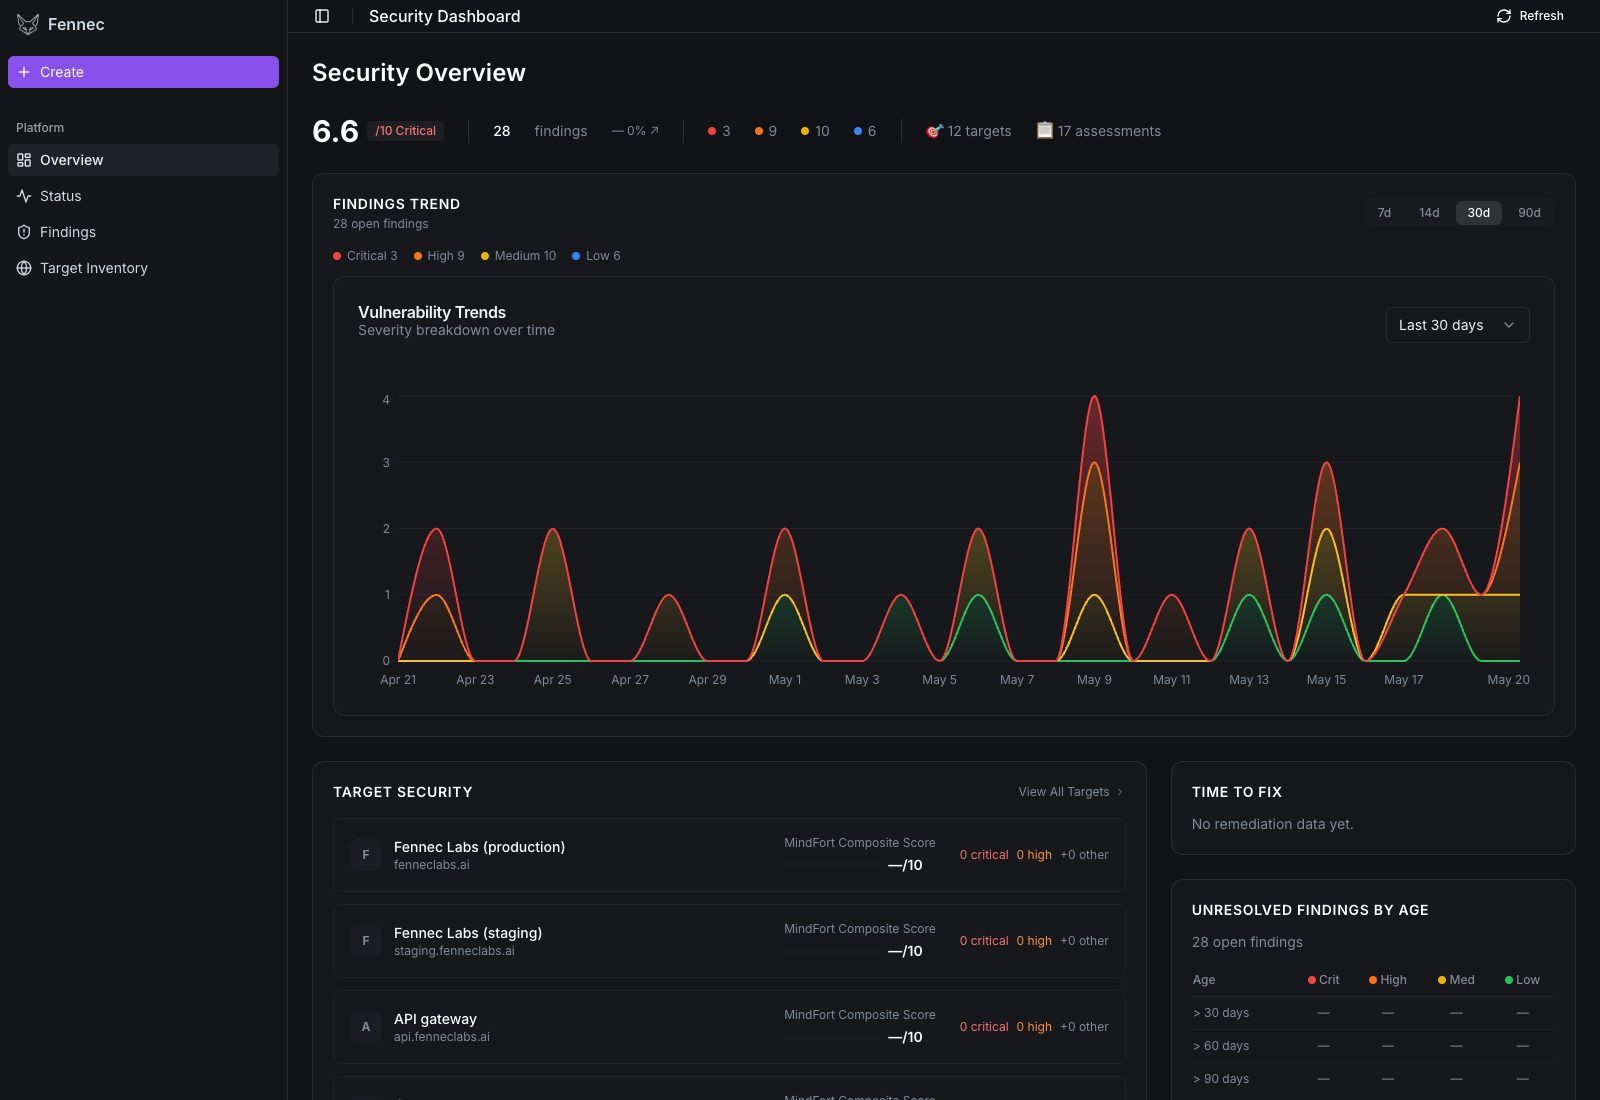
Security Overview — the dashboard's landing page. Composite risk score, severity breakdown, target inventory, time-to-fix, and aging findings, all populated from a real scan.
Why Fennec
Most automated scanners are noise generators. They emit hundreds of "potential" CVE matches that a human has to spend a week triaging — most of which are false positives, version-banner mismatches, or unreachable code paths. Fennec is built differently:
- Every finding is exploitable. The pentester agent doesn't ship a result until it has reproducible evidence: a request, a payload, the observed response. If the agent couldn't actually trigger the vulnerability, it gets marked
safeorinconclusive, not added to the findings list. There's no CVSS-based guessing. - Hypothesis-driven, not signature-driven. Recon maps the attack surface. The analyst forms testable hypotheses ("the
/api/users/{id}endpoint may be vulnerable to IDOR because the auth check looks shallow"). The pentester picks them one at a time and runs targeted tools — not a 1000-rule template sweep. Fewer dead-ends, deeper coverage. - It thinks like an attacker. The coder sub-agent can write custom exploit payloads when an off-the-shelf tool doesn't fit (encoded JWTs, unusual content types, application-specific bypasses). Most scanners can't do this.
- Minutes, not weeks. A typical scan runs in 5–30 minutes per target depending on the assessment depth (
turbo/balanced/deeppresets). Findings appear in the dashboard as the agents confirm them. - You see exactly what it did. Every tool invocation, every response, every reasoning step is captured. Open any finding to inspect the full chain. No black box.
- Your data stays local. No telemetry. No SaaS callback. The agent runs on your laptop, talks to your LLM provider, scans the targets you specify. Findings are stored in-process and exported as JSON / Markdown.
There is a hosted version at fenneclabs.ai with team features, persistent job history, and a managed runner. This open-source repo is the same agent core, stripped of the multi-tenant infrastructure — designed to run on one laptop with one API key.
Requirements
- Docker Desktop (or Docker Engine ≥ 20.10)
- An LLM API key — one of Anthropic (recommended), OpenAI, or OpenRouter
- ~15 GB free disk for the Kali execution image (built once)
- Python 3.11+ only if you want to skip Docker for the agent itself and run the CLI directly
Quickstart (one command, after a one-time build)
git clone [email protected]:NabilAziz99/Fennec.git
cd Fennec

# 1. Drop your API key into .env
cp .env.example .env
echo "ANTHROPIC_API_KEY=sk-ant-..." >> .env

# 2. Build the Kali execution image (one-time, ~5 min, ~14 GB)
cd linux && make build && cd ..

# 3. Bring up the stack
docker compose up --build
Open http://localhost:3000 for the dashboard. Backend API is at http://localhost:8000 (try /health).
If you only want the CLI and not the dashboard, see CLI mode below.
CLI — the same agent, in your terminal
If you live in tmux and don't want a browser tab open, the CLI runs the identical agent pipeline with a live terminal dashboard that mirrors the web UI's Live Activity surface. It subscribes to the same event stream the FastAPI server publishes to the browser — every node_update, tool_call, tool_execution, hypothesis_tree, and finding event lands in the rich-rendered layout below.
What you're looking at, panel by panel:
- Header — target, currently-active agent (with glyph), elapsed clock, assessment method.
- Hypotheses (top-left) — the analyst's full attack tree, parent → child.
◈= in progress (highlighted on the one the pentester is currently hammering),✖= confirmed-vulnerable (severity-coloured),✓= safe,◇= pending. Subtitle shows total / queued. - Live Activity (centre) — timestamped event stream colour-coded by agent (orange = orchestrator, cyan = recon, purple = analyst, red = pentester, green = coder). Tool calls render with the actual command being executed, results render with a preview of the output.
- Latest Tool (right) — the full command + bash-highlighted args of the most recent tool call, with the result body underneath. Long output is head/tail truncated so a runaway
find /doesn't blow out the panel. - Findings (bottom-left) — running tally by severity, plus recon-stat counters (discovered paths, fingerprinted services).
- Footer — animated spinner while agents are working; turns into a finished/failed banner when the run ends.
Run it
Three ways, depending on how interactive you want to be:
# 1. Fully interactive — prompts for target, objective, and method
python cli.py

# 2. One-shot with a target (still drops you into the live dashboard)
python cli.py scan --target https://your-target.example

# 3. Pick a method without prompting
python cli.py scan --target https://your-target.example --method deep
--method accepts turbo / balanced / deep. Add --htli to pause for operator approval before each hypothesis (Human-In-The-Loop mode).
When the run finishes, the live view stops repainting and a static summary block prints below it — a findings-by-severity table, per-vulnerability cards with description + OWASP tag, and the orchestrator's final report. Easy to copy/paste into a ticket or scrollback.
Programmatic interface
For benchmarking, CI checks, or wrapping Fennec in your own tooling, skip the CLI entirely and call the agent directly:
import asyncio
from agent import run_pentest, PentestTask, PentestMode

async def main():
    task = PentestTask(
        target_url="http://localhost:8000",
        description="Find authentication and injection vulnerabilities",
        mode=PentestMode.BLACK_BOX,
        tags=["sqli", "auth"],
    )
    result = await run_pentest(task)
    print(f"Success: {result.success}")
    for v in result.vulnerabilities:
        print(f"  - {v}")

asyncio.run(main())
run_pentest accepts an optional event_sink=async_callback — the same hook the API server uses to push SSE events and the CLI uses to drive the live dashboard. You can wire it into any downstream system (Slack, PagerDuty, a tracing backend, ...) without forking the agent.
Legacy markdown reports
The pre-dashboard CLI is still available behind --legacy, in case you want the line-buffered output and the ./reports/<timestamp>_<host>/summary.md markdown bundle the older release wrote:
python cli.py scan --target https://your-target.example --legacy --output ./reports
Tour
A walk through every page in the dashboard, in the order you'd use them. All screenshots come from the demo seed (FENNEC_DEMO_SEED=1 docker compose up) — flip it on yourself to explore without running a real scan.
Target Inventory — the SaaS surface you've authorised
Twelve targets in the demo: production, staging, the API gateway, customer app, admin console, billing service, docs / blog / status / CDN subdomains, an internal demo app, and a legacy 2021 dashboard. Each card shows the last-scan recency and an at-a-glance findings count. Add Target registers a new domain, the pencil icon edits, the trash icon removes. Per-target credentials (the QA test user, in our case) stay local — only injected into the agent's runtime container when a scan starts.
Assessments — what's running, what ran, what's next
Live workflow stages at the top light up as the current scan progresses (Assessment Started → Authentication → Reconnaissance → Testing (Active) → Validation). Below: any Active Assessments (the row with the spinning Cancel button is a Deep pass on production), scheduled jobs, and a chronological Historical Assessments table — green dot = succeeded with findings, red dot = failed, with method, credential, start, and end timestamps.
Assessment detail — Live Activity
Drill into a single scan. The pipeline timeline shows every stage with its completion state, and the four tabs let you see what the agents actually did. Live Activity is the per-tool-call stream: nmap -sV, gobuster dir, sqlmap against the login form, curl exfiltration probes, web_search for related CVEs — every command, every timestamp, who ran it.
Assessment detail — Hypotheses
The analyst agent's full claim tree for this scan. Each row is a testable hypothesis (UNION-based SQL injection on /api/auth/login, IDOR on /api/users/{id}, stored XSS in the support form, ...) with status, severity badge, priority score, and OWASP category. Confirmed-vulnerable, dead-end, and safe verdicts are all kept — the agent shows its work whether or not the hypothesis paid out.
Assessment detail — Recon Data
The structured attack-surface map the recon agent built before any exploit ran: detected technologies (Nginx 1.25, FastAPI 0.115, PostgreSQL 15.4, React 18.2, Cloudflare, OpenSSH 9.6), every discovered endpoint with parameter list and auth requirement, identified entry points, observed cookies/headers, and free-text notes the agent surfaced ("CSP is report-only", "JWT uses HS256 — verify rotation"). This is what the analyst chews on to form the hypothesis tree above.
Findings — Description tab (the marquee shot)
Every confirmed vulnerability across all scans, severity-sorted in the sidebar. The selected critical-severity finding here is UNION-based SQL injection on /api/auth/login that the agent confirmed via three injection types (error-based, time-based blind, UNION) and used to exfiltrate the first five rows of the users table — including bcrypt hashes — via an unintentional _debug_result field the application leaked. The Description tab shows the technical breakdown of how the agent found and confirmed the bug.
Findings — Impact tab
Demonstrated Impact, Attack Scenarios, Business Risk — written for the engineering manager AND the CISO. From the agent: full read access to users, sessions, api_keys, and billing_accounts; four concrete pivots (offline hash crack → login as user, session-token replay → admin takeover, credential stuffing prep, API-key exfil); GDPR Article 33 notification trigger; estimated remediation cost.
Findings — Evidence tab
The receipts. Every confirmation step the agent took, then Payloads Used — the exact strings it sent, ready to copy into Burp or a curl. No black-box "we think there's a problem here" — the payloads either work for you when you paste them or the finding goes in the false-positive bin.
Findings — Remediation tab
Primary fix (parametrise the query, strip the _debug_result field), Implementation pattern (an actual code diff to apply), and Additional hardening (WAF rule for defense-in-depth, DB-user least privilege, CI lint to fail builds on f-string SQL, password rotation policy). This is a hand-off the engineering team can act on without translating from security-speak.
Demo seed mode
The screenshots above all come from a built-in synthetic seed. To populate the dashboard yourself without running a real scan, set the env var when bringing up the stack:
FENNEC_DEMO_SEED=1 docker compose up --build
The seed creates 12 targets, 17 scans across the last 28 days (one currently running, the rest completed across all severities, one historical failed scan), the full hypothesis tree + tool-call log for the production scan, and 28 findings spread across critical / high / medium / low — including the deep SQL-injection finding shown in the screenshots. It's idempotent: it skips entirely if you already have real scans in the store, so it never collides with a production run.
Walkthrough — your first scan
Once the stack is up:
Open the dashboard at http://localhost:3000. You'll land on the Security Overview — empty at first if you skipped
FENNEC_DEMO_SEED.Add a target. Click Target Inventory in the sidebar → Add Target. Enter a domain you own or have written permission to test (e.g.
http://localhost:9000if you're testing a local app, or your own staging URL). The target gets a verification token; click Verify (in OSS mode this is auto-trust).Optional: add credentials. If your target has a login wall and you want the agent to authenticate, click Add Credential on the target. The agent will use these during recon and exploitation. Plaintext stays only in the local Postgres / in-memory store; nothing is sent to the LLM unless the agent needs to construct an authenticated request.
Start a scan. Click + Create in the sidebar, pick the target, choose a method:
turbo— short tool budgets, ~5 min, good for smoke-testing a targetbalanced(default) — ~15–30 min, a normal pentest passdeep— generous budgets, ~30–60 min, for thorough engagements
Click Start Pentest.
Watch the agents work. The Status page streams live events: recon results, hypotheses being formed, tool calls (nmap, curl, sqlmap, custom payloads), and findings as they're confirmed. The hypothesis tree shows what's pending / in-progress / vulnerable / safe.
Review findings. Open Findings in the sidebar to see confirmed vulnerabilities grouped by severity. Click any finding to drill into the evidence: the exact request that triggered it, the response observed, the OWASP category, the suggested fix, and the full reasoning trail.
Export. Each finding has a JSON export. The agents also dump a Markdown report under
./reports/<timestamp>_<host>/summary.mdfor the CLI flow.
Configuration
Everything is .env-driven. The knobs that matter:
| Variable | What it does |
|---|---|
LLM_PROVIDER |
anthropic (default), openai, or openrouter |
LLM_MODEL |
Model name for the provider (default claude-sonnet-4-20250514) |
ANTHROPIC_API_KEY / OPENAI_API_KEY / OPENROUTER_API_KEY |
One must be set, matching LLM_PROVIDER |
DOCKER_IMAGE |
Kali image tag (default fennec-linux, built by linux/Makefile) |
EXECUTION_MODE |
docker (default — spawn a Kali sibling per scan) or local (run tools in the agent container directly) |
FENNEC_METHOD |
turbo / balanced / deep |
HTLI |
true to pause for operator approval between hypotheses |
RECON_MIN_MODEL_CALLS, ANALYST_MODEL_CALL_LIMIT, PENTESTER_MODEL_CALL_LIMIT |
Per-agent call-budget caps (cost control) |
TAVILY_API_KEY, PERPLEXITY_API_KEY |
Optional — enables enhanced web search during recon |
How it works
┌──────────���──┐     ┌──────────────┐     ┌──────────────┐
│   Recon     │ ──> │   Analyst    │ ──> │ Orchestrator │
│ (scan tools)│     │ (hypotheses) │     │  (routing)   │
└─────────────┘     └──────────────┘     └──────┬───────┘
                                                │
                                                ▼
                                         ┌──────────────┐
                                         │  Pentester   │
                                         │  (testing)   │
                                         └──────────────┘
                                                │
                            ┌───────────────────┘
                            ▼
                     ┌─────────────┐
                     │    Coder    │   invoked by pentester when
                     │ (exploits)  │   custom payload is needed
                     └─────────────┘
- Recon maps the attack surface — endpoints, technologies, auth flows. Built on nmap, curl, gobuster, nuclei, subfinder, httpx, and a browser tool.
- Analyst reads recon data and emits a prioritised queue of testable hypotheses tagged with required skills and OWASP category.
- Pentester picks one hypothesis at a time, runs targeted tool calls, and emits a
PentesterResult(status, verdict, evidence, suggested remediation). Won't fabricate findings — if it can't trigger the vulnerability, the verdict issafeorinconclusive. - Coder writes custom exploit code (Python or shell) when the pentester needs something off-the-shelf tools can't do.
- Orchestrator is not an LLM. It's pure routing logic: process the last pentester result, update the hypothesis tree, decide what's next.
See docs/ARCHITECTURE.md for the deeper breakdown — state schema, LangGraph wiring, middleware chain, method presets.
Differences from the hosted version
| OSS (this repo) | fenneclabs.ai | |
|---|---|---|
| Auth | None — single user | Team accounts, OAuth |
| Job persistence | JSON reports / in-memory | Postgres, full history |
| Queue | One scan at a time | Managed multi-tenant queue |
| Dashboard | Local | Hosted with sharing |
| LLM keys | Yours, in .env |
Managed |
| Updates | git pull |
Continuous |
The agent code itself is identical. Only the surrounding infrastructure differs.
Project layout
.
├── agent.py                # Programmatic API: run_pentest(task) → AgentResult
├── cli.py / cli/main.py    # CLI entrypoint
├── src/
│   ├── api/                # FastAPI server (server.py, job_store.py, events.py)
│   ├── agents/             # recon, analyst, pentester, coder, human_review
│   ├── graph/              # LangGraph wiring + orchestrator routing
│   ├── tools/              # terminal, browser, file_read/write, web_search
│   ├── docker/             # aiodocker wrapper that spawns the Kali container
│   ├── prompts/            # Per-agent system prompts + section composition
│   ├── schemas/            # Pydantic models for tool I/O
│   ├── state/              # FennecState TypedDict + hypothesis/finding types
│   ├── middleware/         # LangChain middleware (budget, truncation, retries)
│   └── orchestration/      # HypothesisManager
├── linux/                  # Kali Dockerfile + wordlists (`make build`)
├── frontend/               # React + Vite dashboard (Apache-licensed)
└── docker-compose.yml
Comments