
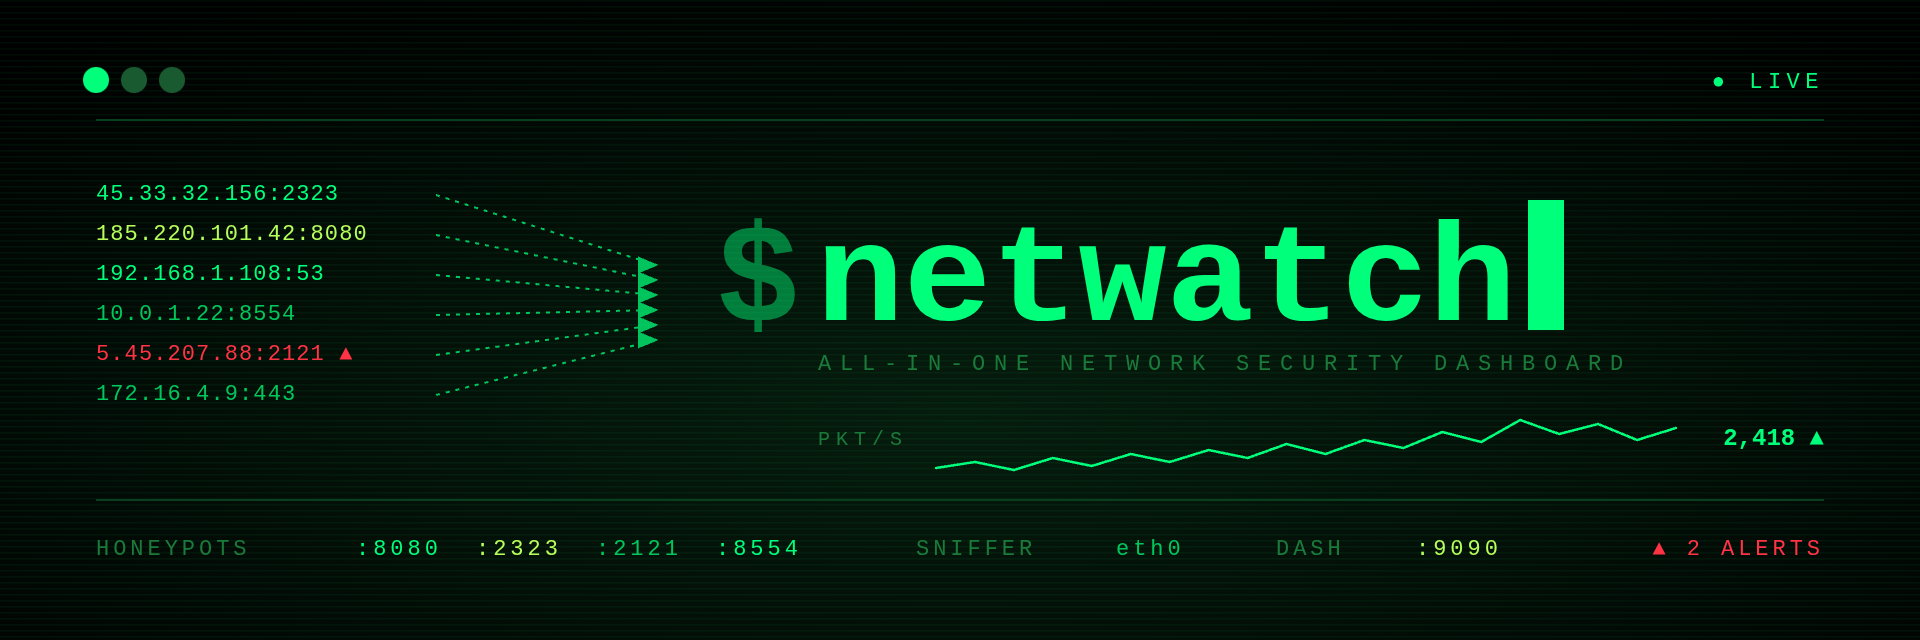
All-in-one network security dashboard — deploy honeypots, capture traffic, run OSINT, scan targets, block threats, and forward alerts over mesh radio. One command, one file, real-time.
sudo netwatch
NetWatch turns any Linux box into a full network security sensor. It deploys 4 honeypot services that lure and log attackers, sniffs all traffic on your interface with raw sockets and tshark, auto-enriches every IP with geolocation and threat scoring, and gives you 100+ commands to investigate, track, and block threats — all from a single terminal or browser.
Built for Raspberry Pi, Kali, Parrot OS, and any Debian-based Linux. Runs as a single Python file with no microservices, no Docker, no cloud dependency.
How It Works
- Launch —
sudo netwatchstarts everything: 4 honeypots bind their ports, raw socket sniffer attaches to your interface, tshark begins protocol analysis, ARP monitor discovers devices, web dashboard opens on :9090 - Capture — Every packet is parsed for source/destination IPs, ports, protocols, and DNS queries. Honeypots log credentials, commands, file uploads, and malware download attempts
- Enrich — Each new IP is automatically scored for threat level based on port behavior, known bad ports, and scan patterns. Run OSINT commands to add geolocation, WHOIS, abuse reports, and ASN data
- Respond — Block attackers with iptables, tag and watchlist IPs, run deep nmap scans, capture payloads, export reports. Forward critical alerts over LoRa mesh radio for off-grid monitoring
- View — Full-screen TUI with 11 tabs, or browser dashboard with live charts, clickable IPs, 5 color themes, and CRT scanline effects
Architecture
┌──────────────────────────────────────────────────────────────┐
│                     NETWATCH v1.1.0                          │
├──────────────────────────────────────────────────────────────┤
│  TERMINAL UI (TUI)        │  WEB DASHBOARD (:9090)           │
│  Full-screen ANSI         │  Flask + SSE live updates        │
│  11 tabs, console mode    │  5 themes, CRT scanlines         │
│  Tab/number key nav       │  Charts, clickable IPs, API      ��
├──────────────────────────────────────────────────────────────┤
│  HONEYPOTS                │  TRAFFIC MONITORING              │
│  HTTP :8080 (NVR panel)   │  Raw socket sniffer              │
│  Telnet :2323 (DVR)       │  tshark protocol analysis        │
│  FTP :2121 (bait files)   │  tcpdump PCAP recording          │
│  RTSP :8554 (camera)      │  ARP device discovery            │
├──────────────────────────────────────────────────────────────┤
│  SCANNING & RECON         │  OSINT (16 tools)                │
│  nmap integration         │  GeoIP, WHOIS, DNS enum          │
│  Port scanning            │  SSL/TLS, HTTP headers           │
│  Service detection        │  Abuse/ASN, cert transparency    │
│  Stealth (Tor) mode       │  Tech fingerprinting, speedtest  │
├──────────────────────────────────────────────────────────────┤
│  DEFENSE                  │  MESH RADIO                      │
│  iptables blocking        │  Meshtastic LoRa support         │
│  Threat scoring           │  Alert forwarding                │
│  Watchlists & tagging     │  Two-way messaging               │
└──────────────────────────────────────────────────────────────┘
Install
Quick install (from PyPI):
sudo apt install -y nmap tshark tcpdump traceroute iproute2 iptables \
                    openssl curl dnsutils whois psmisc arp-scan tor proxychains4
pipx install netwatch-sec
sudo netwatch
From source:
# System tools (one-shot — covers all commands NetWatch shells out to)
sudo apt install -y nmap tshark tcpdump traceroute iproute2 iptables \
                    openssl curl dnsutils whois psmisc arp-scan \
                    tor proxychains4

# Python deps
pip3 install -r requirements.txt

# Optional features
pip3 install graphene flask-graphql    # GraphQL API at :9090/graphql
pip3 install meshtastic                # LoRa mesh radio alerts
sudo apt install -y speedtest-cli      # `speed` command

# Install launcher system-wide
chmod +x netwatch-start.sh
sudo ln -s $(pwd)/netwatch-start.sh /usr/local/bin/netwatch
Quick Start
# Random token each launch (default — more secure)
sudo netwatch

# Persistent token across restarts (requires NETWATCH_FIXED_TOKEN env var)
export NETWATCH_FIXED_TOKEN=$(openssl rand -hex 24)
sudo -E netwatch --fixed-token

# Specific interface
sudo netwatch eth0
On launch a redacted token preview is printed (ABCDEF…WXYZ) and the full token is written to ~/.config/netwatch/token (mode 0600). Use it to log into the web dashboard at http://<your-ip>:9090.
Both TUI and web UI launch together — one command runs everything.
Key & token rotation
From the TUI prompt:
| Command | Effect |
|---|---|
rotate-key |
Generate a new Fernet key — invalidates all active web sessions. Persisted to ~/.config/netwatch/web.key. |
rotate-token |
Generate a new auth token — invalidates all sessions. Re-written to ~/.config/netwatch/token (0600). |
Honeypot ports
Defaults bind to high ports so root isn't required: HTTP :8080, Telnet :2323, FTP :2121, RTSP :8554. Override via env to move to standard ports (needs CAP_NET_BIND_SERVICE or root):
NETWATCH_HTTP_PORT=80 \
NETWATCH_TELNET_PORT=23 \
NETWATCH_FTP_PORT=21 \
NETWATCH_RTSP_PORT=554 \
sudo -E netwatch
Persist by adding to /etc/netwatch.env and referencing in the systemd unit's EnvironmentFile=. Internet-facing scanners hit the standard ports — non-standard ports stay invisible to most drive-by traffic.
Replay tunables
Same-IP telnet attempts roll up into one aggregated session (all_<ip>) so a scanner banging your honeypot all day shows as one entry instead of fifty. Inside the timeline, ── ATTEMPT N (timestamp UTC) ── markers separate bursts. Tune the burst threshold with:
NETWATCH_TELNET_GAP_SEC=86400 sudo -E netwatch # one marker per day (default: 300 = 5 min)
Individual per-attempt sessions remain loadable via their original <ip>_HHMMSS id for drill-down.
CrowdSec auto-ban (optional)
If cscli is installed on the host, every honeypot capture (credential, telnet, ftp, rtsp, malware_attempt, ftp_upload, telnet_cmd) automatically calls cscli decisions add with a 4h ban. The CrowdSec firewall bouncer enforces the drop via ipset, so the rule count never blows up. Same-IP events within 60s are deduped. Set NETWATCH_AUTODEFEND=0 to disable. With no CrowdSec installed, the hook silently no-ops.
Install on Debian:
curl -s https://install.crowdsec.net | sudo sh
sudo apt install -y crowdsec crowdsec-firewall-bouncer-iptables
sudo systemctl enable --now crowdsec crowdsec-firewall-bouncer
Whitelist your operator IP so you don't ban yourself — add /etc/crowdsec/parsers/s02-enrich/whitelists.yaml:
name: netwatch/operator-whitelist
whitelist:
  reason: "operator home"
  ip: ["<your-public-ip>"]
Session Replay
sudo netwatch                                          # capture starts immediately
python tools/synth_ftp_session.py 198.51.100.42        # optional — fake an attacker
# open http://localhost:9090 and click the REPLAY tab
Every captured session (FTP, Telnet, HTTP probes) is recorded as a scrubbable timeline. The web player auto-lists sessions; pick one and step through the keystrokes frame by frame. In the TUI, replay list shows recent sessions and replay <idx> drops into the player.
Player keys: space play/pause · ←/→ step · </> jump session · +/- speed · Home/End ends. Full architecture in docs/DROP4_TUI_REPLAY_PLAN.md.
Remote Access
When cloudflared is available, NetWatch starts a quick tunnel automatically at launch. The public *.trycloudflare.com URL is printed at startup and pinned to the top of the all tab on the dashboard so you can copy it without scrolling through alerts.
# Manual fallback if cloudflared isn't on $PATH
cloudflared tunnel --url http://localhost:9090
Termux / non-root (passive mode)
NetWatch runs on Termux (Android) and any non-root environment in passive mode — honeypots, OSINT, web dashboard, and nmap connect-scan still work. Features that need raw sockets or kernel access are auto-disabled:
| Feature | Root | Termux / non-root |
|---|---|---|
| Honeypots (HTTP/Telnet/FTP/RTSP) | ✓ | ✓ |
| Web dashboard + OSINT | ✓ | ✓ |
nmap (connect / -sV) |
✓ | ✓ |
Raw-socket sniffer / traffic |
✓ | — |
tshark / tcpdump capture |
✓ | — |
| ARP monitor | ✓ | — |
block / unblock (iptables) |
✓ | — |
nmap SYN scan (-sS) |
✓ | — |
# Termux quick start
pkg install python nmap whois tor
pip install netwatch-sec
netwatch                    # passive mode — no sudo needed
Terminal UI
Three screens, hotkey-toggled. Switching screens keeps your tab and scroll position.
| Screen | Hotkey | Purpose |
|---|---|---|
| Dashboard | F1 |
11 tabs, live host/protocol/honeypot view |
| Command Line | F2 |
Full-screen prompt + command output |
| Console | F3 |
Full-screen log of tool output |
F1 / F2 / F3       Switch screens
1-9, 0             Jump to tab
Type anything      Open command prompt
Up/Down            History recall
PgUp / PgDn        Scrollback
Home / End         Top / bottom
ESC                Close help overlay
clear              Wipe console buffer
Tabs
all · hosts · proto · dns · honeypot · nmap · arp · alerts · osint · proxy · mesh
Web Dashboard
Browser UI on :9090 with live SSE updates, 5 themes, and CRT scanline effects.
- Themes: Terminal Classic, Matrix Green, Midnight Blue, Cyberpunk, Light Mode
- CRT Scanlines: Off, Soft, Heavy — retro terminal aesthetic
- Charts: Live traffic timeline, protocol distribution, threat breakdown
- Click any IP for context menu — scan, geo, whois, traceroute, full recon
- Resizable output panel with drag handle
- Host detail modal with ports, tags, OSINT results, honeypot activity
- Keyboard shortcuts: 1-0 for tabs,
/to focus command bar, ESC to dismiss
Security
- Token auth required (auto-generated or
--token <val>or env varNETWATCH_TOKEN) - Fernet-encrypted session cookies, key persisted at
~/.config/netwatch/web.key - Private network access only (127/10/192.168/100.64)
- CSRF origin validation on all POST endpoints
- Destructive commands disabled via web
- SSRF protection on outbound OSINT (fails closed, private IP rejection)
- Rate limiting: 20 cmd/min, 3 expensive/min per IP
- CIDR max /20 on web scan commands
- Nmap target validation at function entry (regex + flag allowlist)
Commands
OSINT (16 tools)
| Command | Description |
|---|---|
geo <ip> |
IP geolocation |
whois <ip/domain> |
WHOIS lookup |
dnsinfo <domain> |
DNS enumeration (A/AAAA/MX/NS/TXT/SOA/CNAME/SRV) |
rdns <ip> |
Reverse DNS |
ssl <host> [port] |
TLS certificate inspection |
secheaders <url> |
Security header audit + grade |
techstack <url> |
Web technology fingerprinting |
ping <ip> [count] |
Jitter analysis + TTL OS guess |
health <target> |
Full profile (ping + SSL + headers + tech + geo + DNS) |
etrace <target> |
Enriched traceroute with per-hop GeoIP |
portscan <ip> |
Socket-based top 1000 port scan |
subnet [cidr] |
Threaded ping sweep |
crt <domain> |
Certificate transparency search |
headers <url> |
HTTP response headers |
asn <ip> |
ASN/BGP info |
abuse <ip> |
IP reputation check |
speed |
Network speed test (download/upload/ping) |
ifinfo |
Local interface info + routing table |
Scanning
| Command | Description |
|---|---|
scan <ip> [preset] |
Nmap scan (quick/syn/udp/ping/full) |
deep <ip> |
All ports + vuln scripts |
stealth <ip> |
SYN scan through Tor |
recon <ip> |
Full OSINT profile |
fullrecon <ip> |
7-phase recon chain |
sweep [cidr] |
ARP + ping + port scan |
banner <ip> <port> |
Service banner grab |
trace <ip> |
Traceroute |
Tracking & Capture
Requires root. Disabled automatically in passive mode.
| Command | Description |
|---|---|
track <ip> [secs] |
Live packet tail (tshark) |
conns <ip> |
TCP conversation capture |
sniff <ip> [secs] |
Raw payload capture |
trackdns <ip> |
DNS query capture |
pcap start/stop |
PCAP recording |
Defense
| Command | Description |
|---|---|
block <ip> |
iptables DROP (root only) |
unblock <ip> |
Remove block (root only) |
blockall attackers |
Block all honeypot IPs (root only) |
diffarp |
ARP table change detection |
System
| Command | Description |
|---|---|
status |
Service info + uptime |
dashboard / d |
Return to dashboard screen |
clear |
Wipe console buffer |
help |
Show full reference overlay |
rotate-key |
New Fernet key (invalidates web sessions) |
rotate-token |
New web auth token (invalidates sessions) |
Smart Filters
| Command | Description |
|---|---|
top [n] |
Top N talkers |
sus |
Suspicious hosts (threat > 0) |
new [mins] |
Recently appeared |
loud |
Most ports touched |
find <pattern> |
Search all data |
ports <port> |
Hosts using port |
country <CC> |
Filter by country |
Batch Operations
scanall [list] reconall [list] geoall [list] whoisall [list]
Lists: hosts · attackers · arp · nmap · watchlist · tracked · blocked
Use @N to reference IPs by index: scan @3 scans the 3rd IP in the current list.
Proxy / Tor
proxy add socks5 127.0.0.1:9050    proxy list
proxy test                         proxy rotate
proxy start                        proxy stop
Mesh Radio
mesh send <text> mesh status mesh nodes mesh alert on/off
Honeypots
| Service | Port | Captures |
|---|---|---|
| HTTP NVR Panel | 8080 | Credentials, session tokens, API probes |
| Telnet DVR | 2323 | Login attempts, shell commands, malware downloads |
| FTP Bait Server | 2121 | Credentials, keystroke logs, file uploads (max 10MB) |
| RTSP Camera | 8554 | Auth probes, stream requests |
All events logged to JSON with ANSI-stripped, sanitized data. Connection limits per service (50 max). FTP has path traversal protection and filename sanitization.
Session replay → GIF
Turn any FTP session log into a watchable asciinema cast and GIF:
python3 tools/replay_to_gif.py logs/ftp_session_<ip>_<ts>.log demo.gif
Real attacker cadence preserved, idle stalls compressed. Requires agg for the GIF step.
GraphQL API
Available at :9090/graphql when graphene is installed.
{ hosts(minThreat: 10, limit: 20) { ip hostname threatScore tags } }
{ honeypotEvents(service: "telnet") { time ip summary } }
mutation { runCommand(cmd: "geo 8.8.8.8") { output } }
Testing
python3 -m pytest tests/ -q
# 1900 tests, ~30s on a Pi 5
Lint (CI threshold --fail-under=9.0):
pylint $(git ls-files '*.py') --fail-under=9.0
Security Model
- All subprocess calls use argument lists, never
shell=True - Nmap target regex validation at function entry + flag allowlist
- ANSI escape stripping on all logged data (log injection prevention)
- FTP upload path traversal blocked via
os.path.realpathchecks - FTP data connection synchronized with
threading.Event - Session stores bounded with TTL eviction
- Log rotation at 50MB
- SSRF protection: private IP rejection on outbound OSINT, fails closed on DNS errors
- PTR records never trusted for security decisions
- Flask secret keys randomized per startup
- Fernet-encrypted web cookies — no plaintext fallback
- Thread-safe rendering with RLock synchronization
- GraphQL query complexity limited (depth 7, aliases 10, length 4000)
- Web API rate limiting: 20 cmd/min, 3 expensive/min per IP
- CIDR max /20 on web scan commands
Requirements
| Component | Details |
|---|---|
| OS | Linux (Debian, Ubuntu, Raspbian, Parrot, Kali) — also runs on Termux (Android) in passive mode |
| Python | 3.9+ |
| Root | Recommended (raw sockets, iptables, sub-1024 binding). Non-root and Termux run in passive mode (honeypots, OSINT, web, nmap connect-scan). |
| System | nmap, tshark, tcpdump, traceroute |
| Python | flask, requests, python-whois, dnspython, markupsafe, cryptography |
| Optional | graphene, flask-graphql, meshtastic, speedtest-cli |
Tested on Raspberry Pi 5, Parrot OS, and Termux (Android, passive mode).
Deploy
git clone https://github.com/Mattmorris-dev/netwatch-sec.git && cd netwatch-sec
sudo apt install nmap tshark tcpdump traceroute
pip3 install -r requirements.txt

# System-wide install
sudo ln -s $(pwd)/netwatch-start.sh /usr/local/bin/netwatch

# Start on boot (optional)
sudo cp netwatch.service /etc/systemd/system/
sudo systemctl enable --now netwatch

Headless Mode
No TTY detected (SSH pipe, systemd, Docker) = headless mode. Web dashboard only on :9090. All honeypots and traffic monitoring still active.
Comments