git-newspaper processes the commit history of any git repository and outputs a single-page HTML file styled as a Victorian-era broadsheet newspaper. Each section pulls directly from git data like commit messages, authors, line changes, deleted files, and activity patterns. The result opens in a browser as newspaper.html, complete with inline fonts, styles, and a preview image showing a sample layout.
This tool runs locally without external APIs, LLMs, or network calls. It uses Node.js and the simple-git library to parse git log --stat. A seeded random number generator ensures the same repository always produces identical output. The project has 104 GitHub stars and is written in JavaScript, available at github.com/LordAizen1/git-newspaper and npmjs.com/package/git-newspaper.
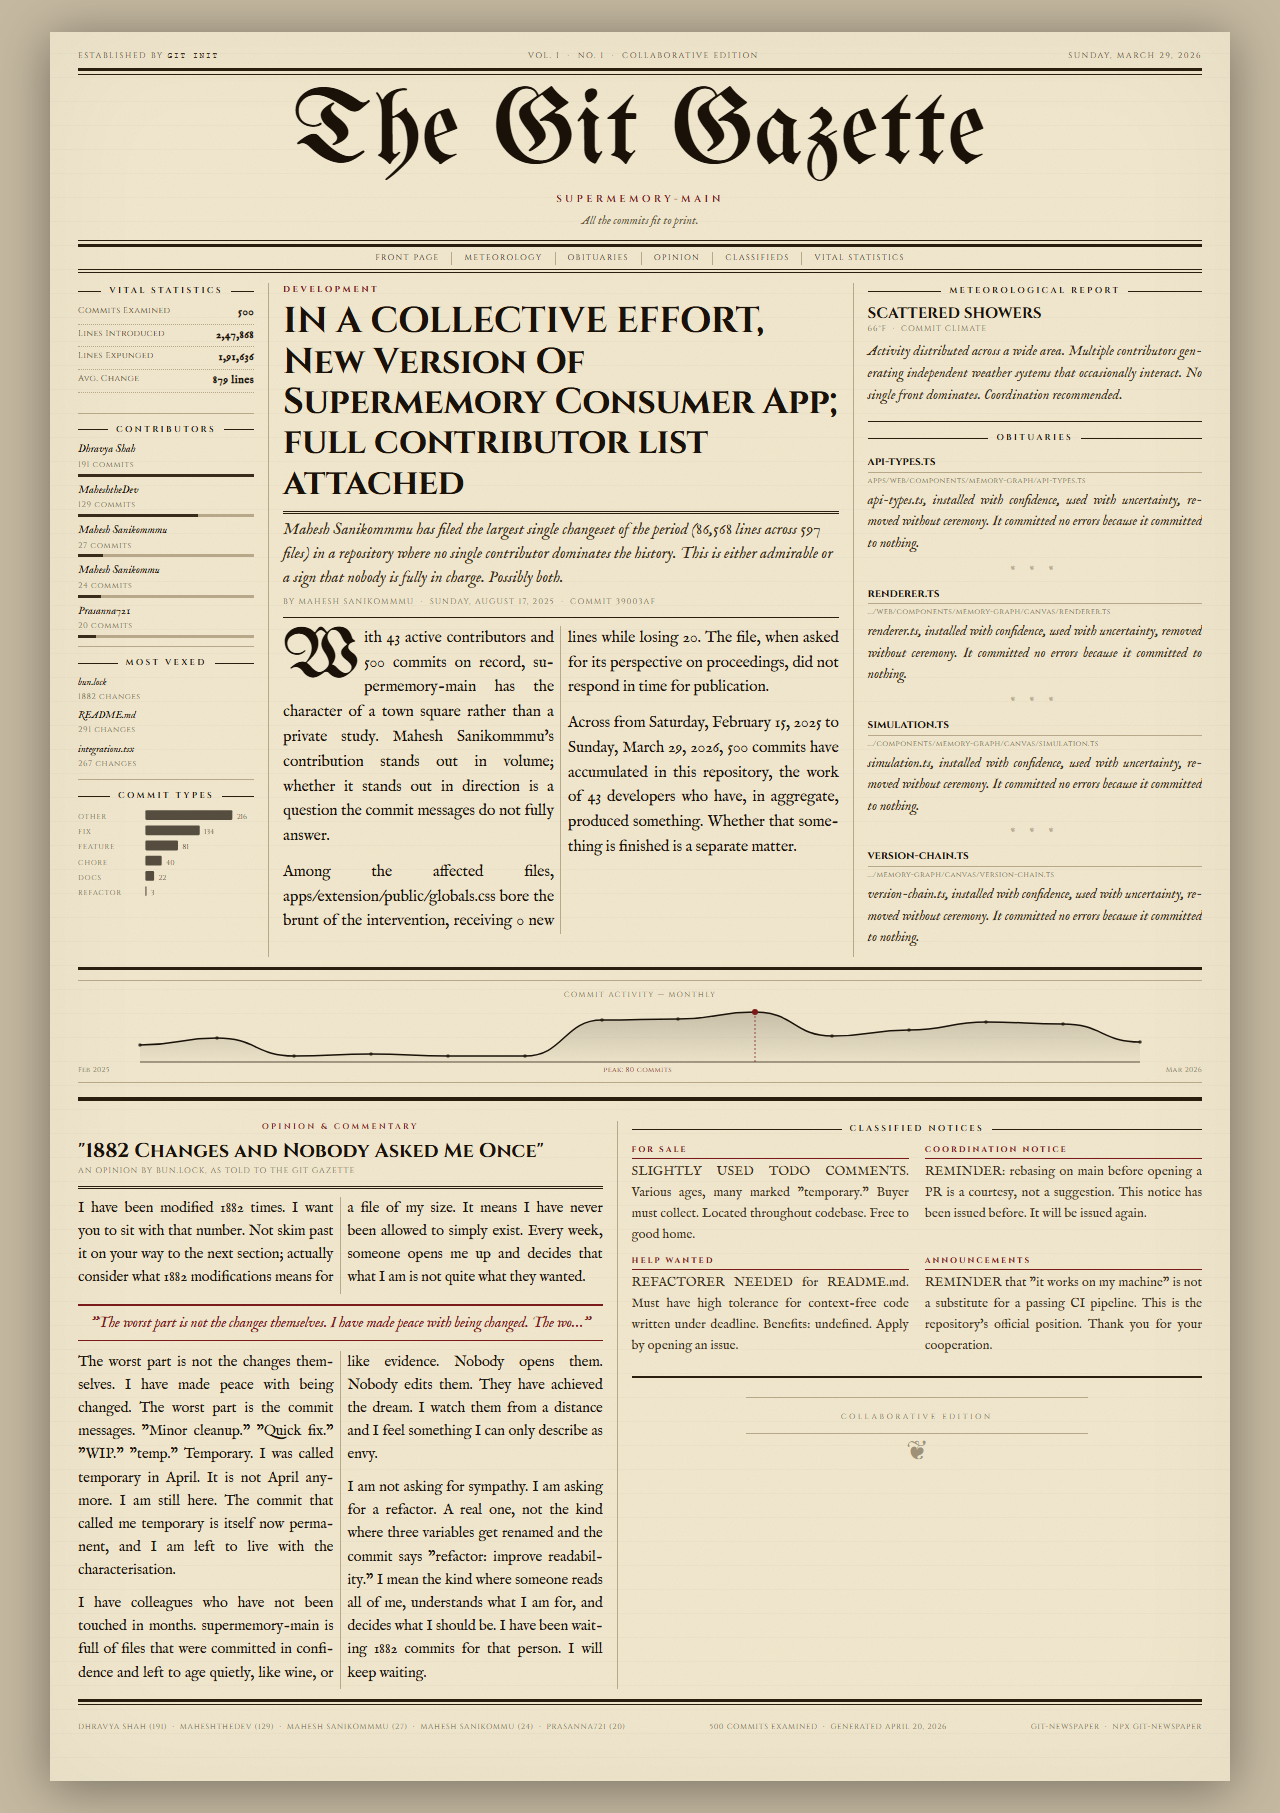
Newspaper sections
The generated page divides into fixed sections, each derived from repository stats over a chosen period.
- Front page headline: Names the commit with the most lines changed.
- Lead article: Summarizes authors, total file counts, and date range.
- Meteorological Report: Maps commit sentiment and activity spikes to weather metaphors.
- Obituaries: Lists files deleted during the period.
- Opinion column: Focuses on the most-edited file, generating text in first person from its changes.
- Vital Statistics: Ranks commits, top authors, and code churn.
- Commit Activity: Shows a timeline chart of commits.
- Classifieds: Tailors notices to detected repository patterns.
No content is fabricated; everything traces to git logs.
Repository archetypes
git-newspaper scans commits to classify the repository and picks matching templates for layout and tone. Triggers include revert percentages, author dominance, or commit types.
| Archetype | Trigger | Edition |
|---|---|---|
| Revert Crisis | >12% reverts | Crisis Edition |
| Solo Marathon | One author >70% commits | Profile Edition |
| Ghost Town | <8 commits | Quiet Edition |
| Dependency Churn | >35% touch lock files | Administrative Notice |
| Refactor Sweep | >25% refactors | Infrastructure Report |
| Bugfix Crisis | >35% fixes | Emergency Edition |
| Feature Sprint | >35% features | Launch Edition |
| Collaborative | 5+ authors, 40+ commits | Collaborative Edition |
| Balanced | Default | Morning Edition |
These adjust phrasing and emphasis without altering facts.
Getting it running
Node.js 18 or later is required, plus a git repo with commits. No other dependencies install by default.
Run directly with npx:
npx git-newspaper
This analyzes the current directory's repo and opens the result in a browser.
For global install:
npm install -g git-newspaper
git-newspaper
Key options include:
# Target a different repo
git-newspaper --repo /path/to/repo

# Limit time scope
git-newspaper --since "2 weeks ago"
git-newspaper --since "2024-01-01"

# Custom output
git-newspaper --output my-paper.html
git-newspaper --limit 200  # Max commits, default 500
git-newspaper --no-open    # Skip auto-open
PNG export
To save as an image, install Playwright first:
npm install -D playwright
npx playwright install chromium
git-newspaper --format png
This screenshots the HTML using Chromium.
How it processes data
The tool executes git log --stat via simple-git to gather stats on lines added/removed, file changes, and messages. It categorizes commits (e.g., by keywords like "fix", "feat", "revert") and detects archetypes from ratios. Templates fill sections using this data and a fixed seed for consistency. The HTML is self-contained for offline viewing.
Who this fits
Developers and teams use it to visualize repo history in a shareable, printable format. A solo contributor might run it after a feature branch to see their "Solo Marathon" profile. Open-source maintainers could generate papers for release notes or retrospectives, highlighting churn or collaborations. It suits git-heavy workflows where plain git log feels dry—turn a month's activity into a front-page story for a team meeting or blog post.
Quiet repos trigger a "Ghost Town" edition with minimal content, while high-revert projects get crisis-themed warnings. If your repo has lockfile churn from dependencies, expect administrative notices in the classifieds.
Comparisons to other tools
No direct equivalents exist for newspaper-style git visualization. Standard git commands like git log --stat --since="2 weeks ago" output tables, lacking the formatted, thematic presentation. Tools such as git-extras (with git effort for churn stats) or git-quick-stats provide summaries but stay terminal-bound.
For charts, git-quickstats generates activity graphs, though less polished than git-newspaper's timeline. Contribution graphs in GitHub or git-fame focus on per-file blame without archetypes or narratives. If you need API-driven insights, git-history or forgejo/ gitea plugins offer visuals but require servers. git-newspaper stands out for zero-setup, offline use on any repo.
This weighs in at a single Node tool versus heavier dashboards like GitLab's built-in analytics. It's lighter than browser-based git visualizers like GitGraph.js, which require manual commit input.
git-newspaper works best on active repos with 8+ commits; sparse histories yield thin papers. Source at GitHub, MIT licensed.
Comments