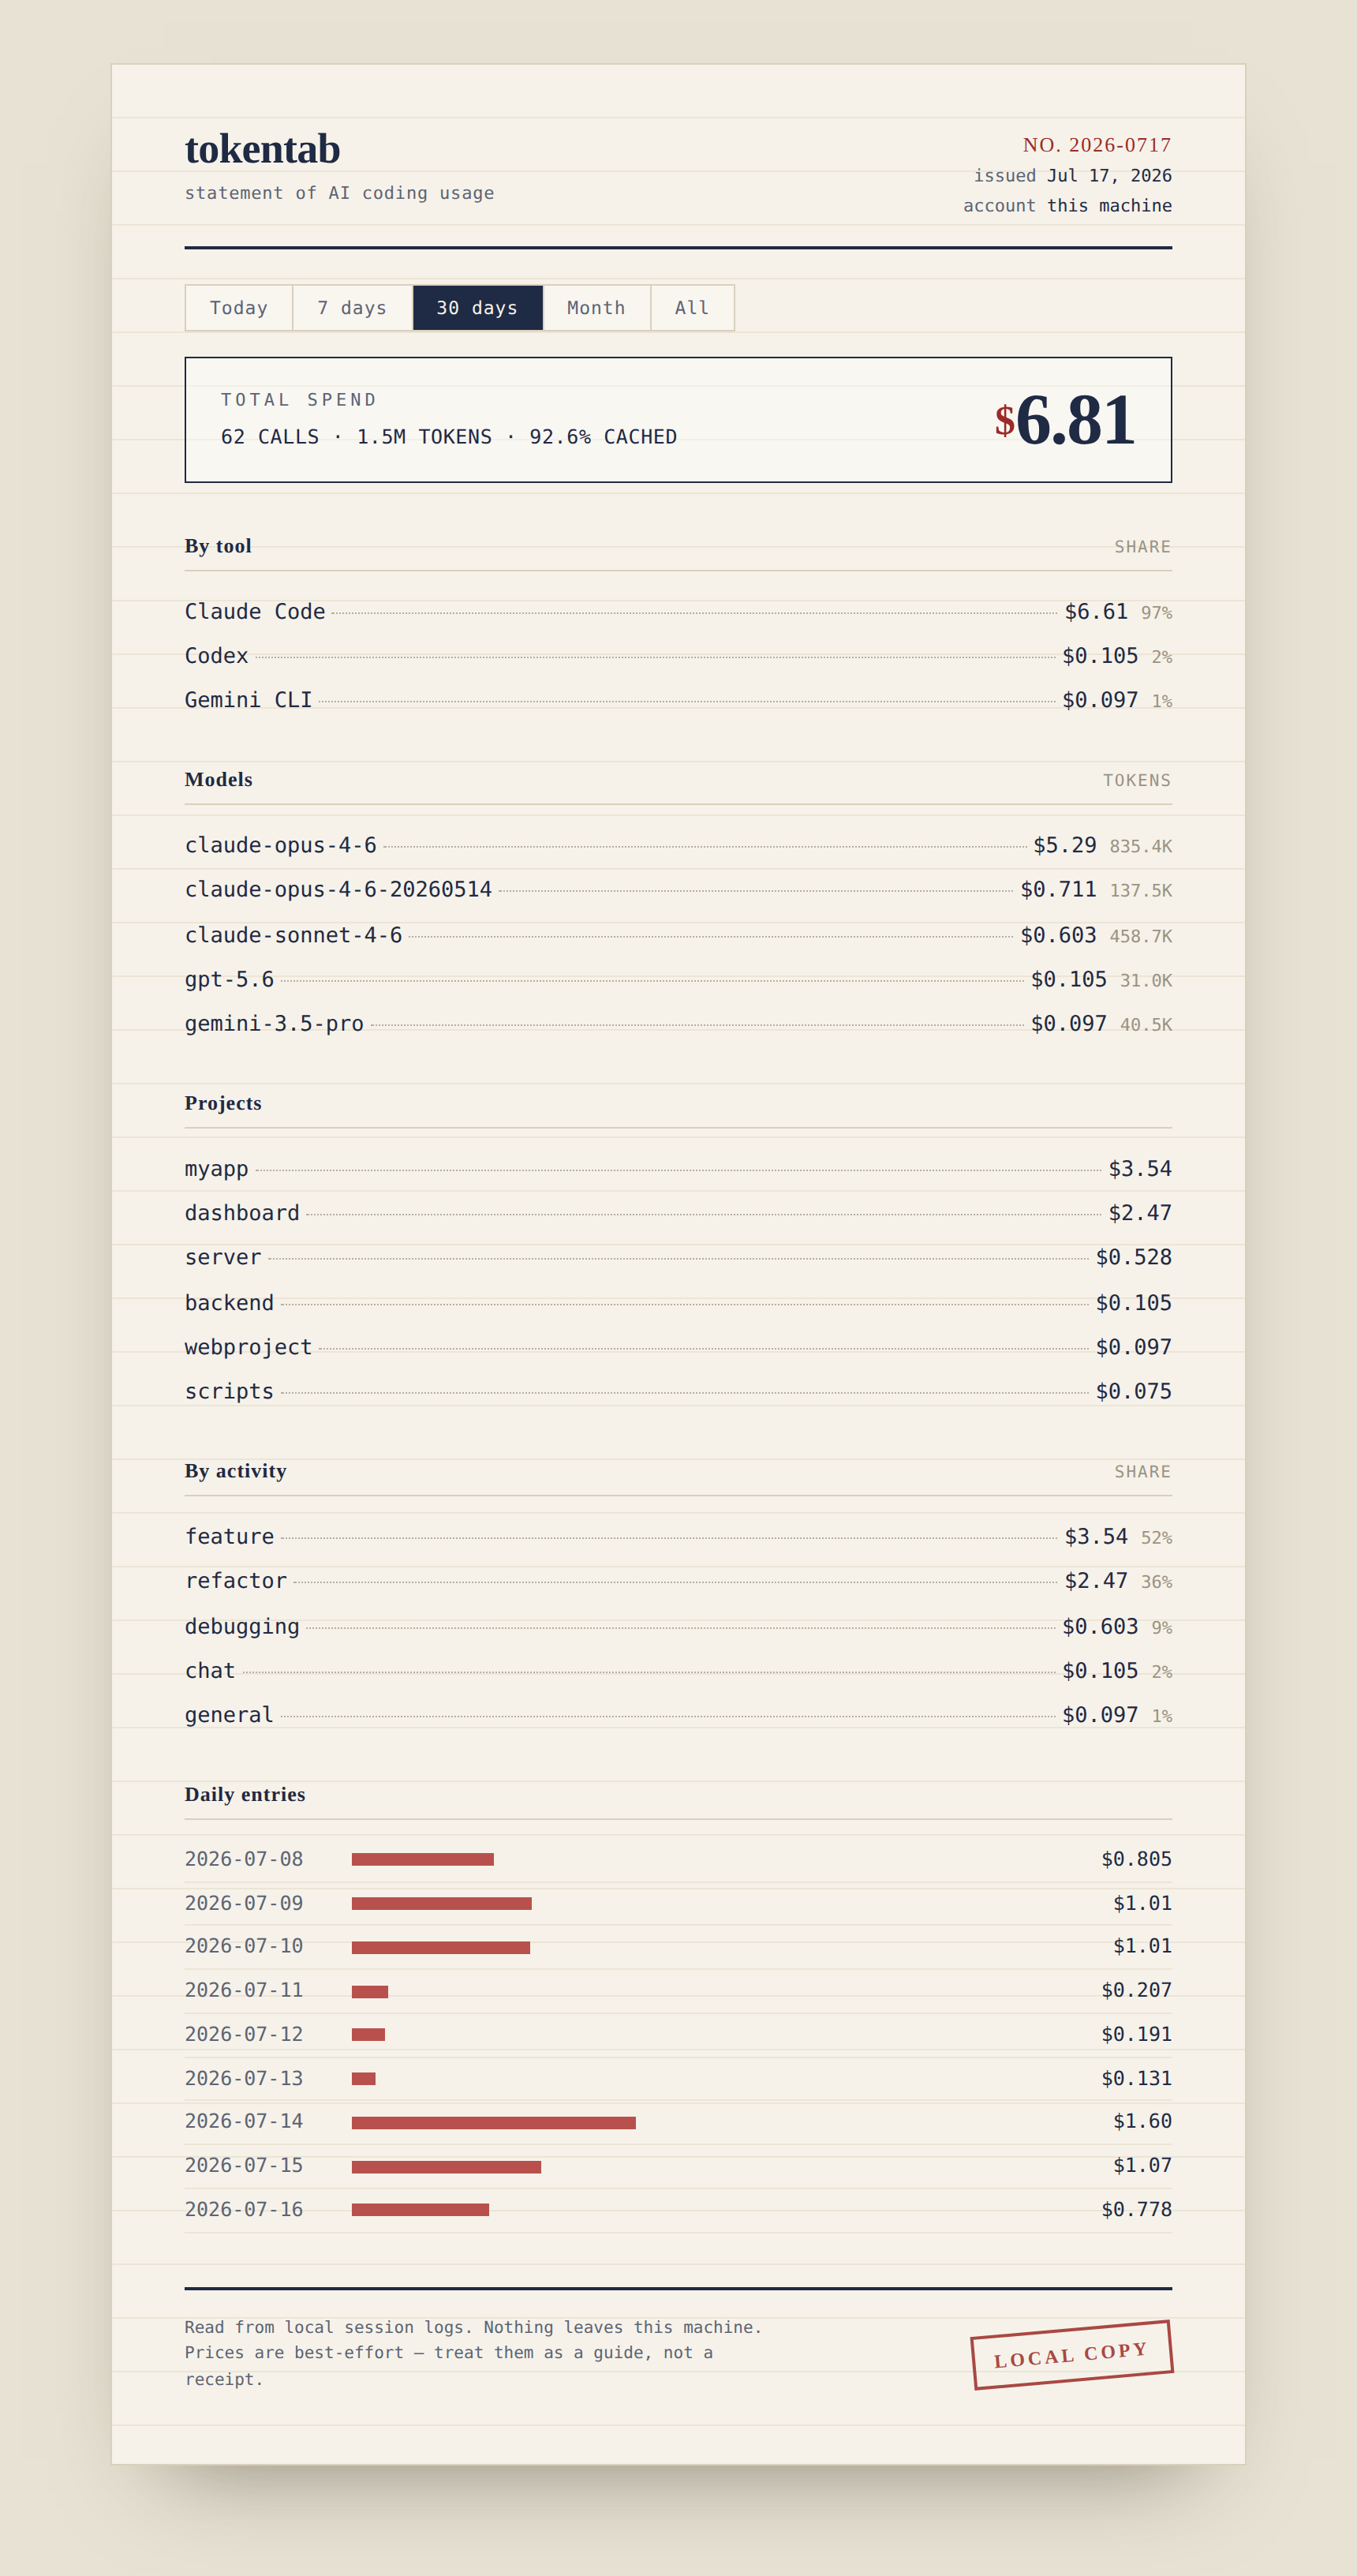
tokentab reads the session logs that Claude Code, Codex, Cursor and Gemini CLI already leave on disk and adds up token usage and cost - broken down by model, by project, by day, and by the kind of work each session was doing. It runs entirely locally: no account, no API key, nothing leaves your machine.
Installing
Clone the repo and install it into your environment:
git clone https://github.com/sequilade/tokentab
cd tokentab
pip install -e .
tokentab
That puts a tokentab command on your path. You can also run it without installing at all - see From source.
What it reads
It understands three tools out of the box, plus a Cursor slot that's wired up but not finished (more on that below).
| Tool | Where its logs live |
|---|---|
| Claude Code | ~/.claude/projects/**/*.jsonl |
| Codex | ~/.codex/sessions/**/rollout-*.jsonl |
| Gemini CLI | ~/.gemini/tmp/**/session-*.json |
| Cursor | (stub - see below) |
If a tool isn't installed, it's just skipped. You'll only ever see the tools you actually use.
Using it
The bare command gives you the last 7 days across everything:
tokentab
Some other things it does:
tokentab today                     # just today
tokentab month                     # this calendar month
tokentab -p all                    # everything you've ever run
tokentab --provider claude         # one tool only
tokentab --project myapp           # one project
tokentab --from 2026-06-01 --to 2026-06-15   # a specific window
tokentab --json | jq .             # machine-readable, pipe it wherever
tokentab web                       # the same thing, in a browser, with charts
Colour drops automatically when you pipe the output somewhere, so pasting into a PR or a chat doesn't drag a load of escape codes along with it.
The web dashboard
tokentab web
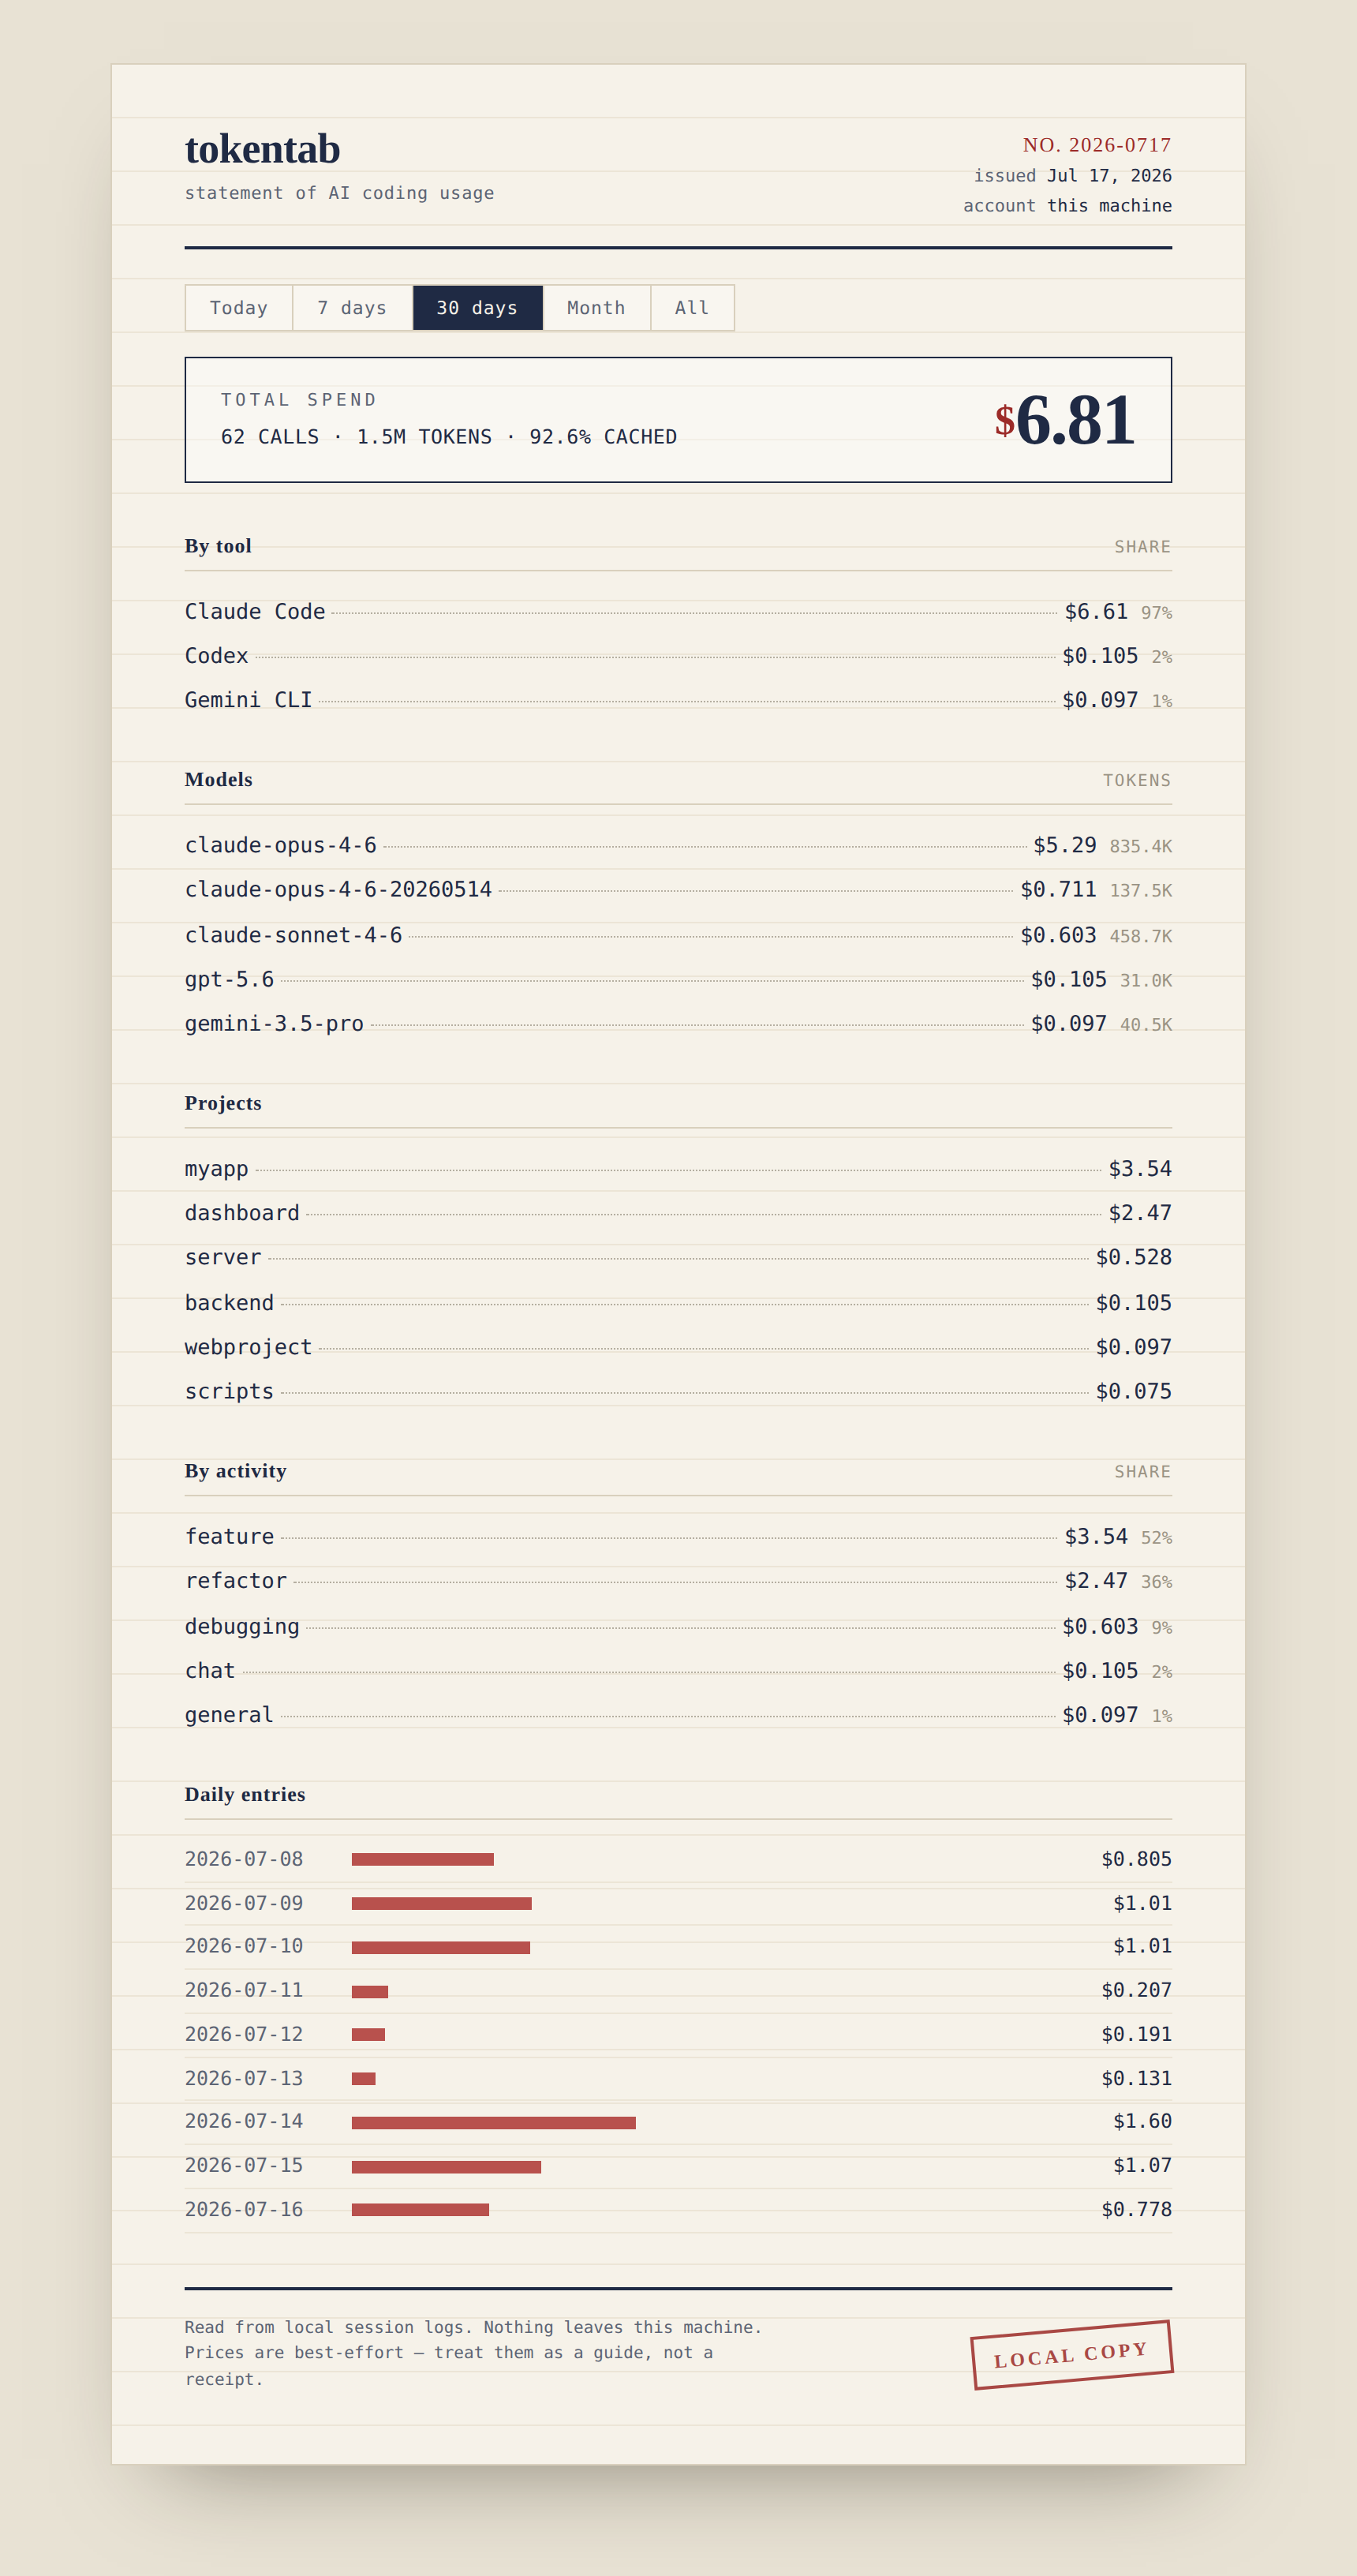
Opens http://localhost:4747 and lays the same numbers out as a monthly statement - total up top, everything itemised below. It reads from disk on every request (the data's tiny, so there's no reason to cache and risk showing you something stale) and binds to localhost only - nothing gets uploaded, same as the CLI. It doesn't even pull fonts from a CDN; it uses whatever serif and mono your system already has, so it works with the network unplugged. Pick a port with --port, or pass --no-open if you don't want it grabbing your browser.
It's built on Python's standard-library HTTP server - no Flask, no framework, nothing extra to install.
How the numbers are worked out
Tokens come straight from the logs - every one of these tools records its own token counts per call, so nothing here is guessed. The one wrinkle is caching: Claude splits cache reads and writes out separately, and Gemini reports input including the cached part, so tokentab pulls the cached tokens back out before pricing to avoid charging you twice for the same thing.
Prices are a hand-kept table in tokentab/pricing/prices.py, in dollars per million tokens. It's a table on purpose - the tool never reaches out to the network to price anything, and a slightly-stale number beats a crash when a vendor renames a model overnight. The matching is fuzzy: claude-opus-4-6-20260514 still finds claude-opus-4-6. If a model shows up as $0.00, it means the name didn't match anything in the table - add a line and it's sorted. The CLI says so when it happens instead of quietly counting it as free.
Activity (coding / debugging / refactor / testing / etc.) is a guess based on which tools got used and the wording of your first message in a session. It's deterministic - no model calls - so it's fast and you can eyeball whether it's roughly right. Treat it as a hint, not gospel.
Adding another tool
Every provider is a single module in tokentab/providers/ that exposes a collect() function returning a flat list of UsageRecords (the shape's in tokentab/types.py). Write the module, add it to the list in tokentab/providers/__init__.py, done - pricing, grouping, the dashboard, all of it just works because everything downstream only ever touches that one shared shape. The three real parsers are worth a read as templates; Claude's is the simplest place to start.
From source
git clone https://github.com/sequilade/tokentab
cd tokentab
pip install -e .
tokentab
The only third-party dependency is rich, for the terminal tables. Everything else - the web server, the parsers, the JSON - is Python's standard library.
Reading the output
A few patterns worth knowing when you look at your own numbers:
- Cache hit under ~80%, consistently - your context probably isn't stable between calls, or caching isn't switched on. One weird session is nothing; weeks of it is worth a look.
- A big model dominating cost on lots of tiny calls - you might be reaching for the expensive one on work a cheaper model would one-shot.
- "chat" or "exploring" eating a big share - a lot of the spend went to talking and reading rather than editing. Sometimes that's the job; sometimes it's a sign a session wandered.
These are starting points, not verdicts. The tool shows you the data: you know what the work actually was.
Notes
Prices are best-effort - if you spot a stale one, a one-line PR or an issue is welcome. Everything runs locally.
Comments