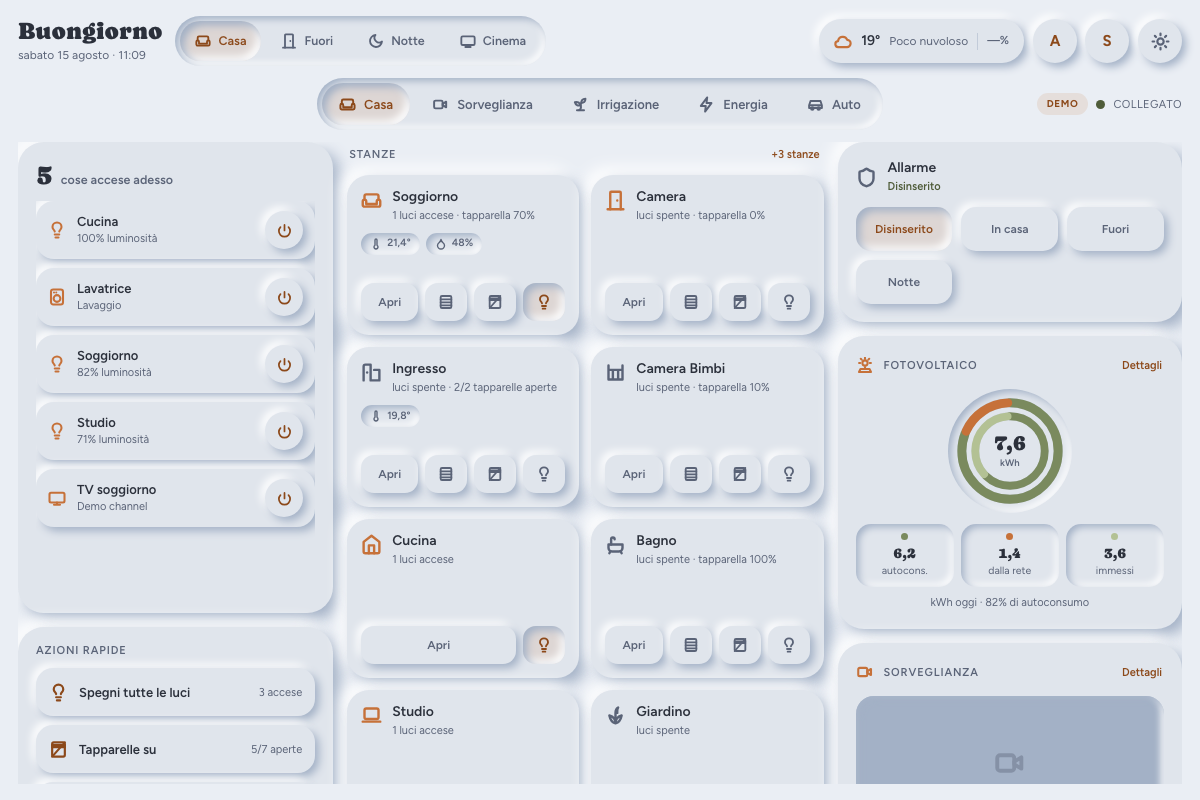

What this is, and isn't
- A single page that lives in its own
panel_custompanel, not a Lovelace dashboard and not a card. It doesn't try to be either. - Built for a tablet mounted on a wall, in landscape, at a fixed 1200×800-ish size — that constraint is deliberate (see "Kiosk mode" below), not a bug. Individual columns (rooms, cameras) size their tiles to content rather than stretching to fill the page, and scroll internally if an install has enough of them to exceed the available height.
- The mobile page (
dash_neumo_mobile.html) is a real, complete second layout for phones, but it's secondary: the design decisions (grid density, no scroll) are made for the wall tablet first.
Requirements
- Home Assistant with
www/access (to copy files intoconfig/www/) and aconfiguration.yamlyou can edit for thepanel_customintegration. - No minimum version is enforced, but the area/device/entity registry calls
this uses (
config/area_registry/listetc.) have been standard since Home Assistant 2022.x; anything reasonably current works. - No npm, no build step. Everything is plain HTML/CSS/JS, loaded as ES
modules straight from
config/www/.
Installation
There are two ways to install this: via HACS (recommended — you get update
notifications and a one-click update whenever a new version is tagged), or
by copying the files by hand. Both end up running the same dashboard; the
only real difference between them is module_url and where the plugin's
files live, which matters if you ever migrate from one to the other.
Via HACS (recommended)
In HACS, add this repo as a custom repository: ⋮ menu → Custom repositories, URL
https://github.com/mbonny95/live_dashboard, category Dashboard.Find "Live Dashboard" in HACS and click Download. HACS installs it into
config/www/community/live_dashboard/— that exact path, not a name you choose (this is HACS's own convention for the Dashboard category, and it's what thename:/module_url:below assume).Add to
configuration.yaml:panel_custom: - name: live_dashboard-panel url_path: casa sidebar_title: Casa sidebar_icon: mdi:home-heart module_url: /local/community/live_dashboard/panel.js?v=1.6.0 embed_iframe: true trust_external_script: falsename:has to be exactlylive_dashboard-panel— the panel element registers itself under<folder>-panel, derived from the folder it's running from, and for a HACS install that folder is alwayslive_dashboard. Get this wrong and the panel loads blank/black — but within a couple seconds it now tells you exactly why, both as aconsole.errorand as a message on the page itself, naming thename:it expected and the folder it actually found itself running from.The
?v=1.6.0onmodule_urlmatters more than it looks:/local/is served with long cache headers, and browsers cache ES modules particularly aggressively, so a plain hard refresh doesn't reliably force a re-fetch ofpanel.jsafter an update. Match it to the version you just installed (shown in HACS, and logged to the browser console on load as[live_dashboard] vX.Y.Z) and bump it again the next time you update.Restart Home Assistant —
panel_customentries are registered at startup, not hot-reloadable, so editingconfiguration.yamlalone has no effect until you restart. Then open the new sidebar entry.
Important — read this before you hit an update:
- HACS updates the plugin's files, never
configuration.yaml. You write thepanel_customblock once, above, and never touch it again for routine updates. - Your own config goes in
config/www/live_dashboard_config.js— one level up fromconfig/www/community/live_dashboard/, not inside it. That inner folder is fully overwritten by every HACS update, so a config file placed there is deleted the next time you update;config/www/itself is never touched by HACS. See "Configuring the rest" below.
Manual installation
Copy the whole
public/folder intoconfig/www/casa/(rename as you like —casais just what the example below uses; this is also how you can run a second copy side by side, e.g.casa2/, without touching a workingcasa/install).Add to
configuration.yaml.name:must be<folder>-panel, matching whatever folder you chose above:panel_custom: - name: casa-panel url_path: casa sidebar_title: Casa sidebar_icon: mdi:home-heart module_url: /local/casa/panel.js?v=1 embed_iframe: true trust_external_script: falseSame cache-busting note as above: bump
?v=1→?v=2→ … yourself every time you update the files in this folder, since there's no HACS version to read it from here.Restart Home Assistant, then open the new sidebar entry.
Migrating from a manual install to HACS? The module_url and name:
above are different between the two — update both lines, not just one, or
the panel will keep loading the old copy (or nothing at all).
The side-by-side pattern above (casa / casa2) is manual-install only —
it doesn't apply to HACS. Under HACS the folder is always live_dashboard,
so name: is always live_dashboard-panel, not something you pick per
copy. Carrying the manual habit of choosing your own name: over to a HACS
install is the single most common way to end up with name: not matching
the folder the panel actually registers itself from — see the note under
"Via HACS" above for what that looks like when it goes wrong.
That's it — with no config file at all, the dashboard auto-discovers your
areas and shows up to 12 of them as room tiles, plus any person.* entities,
the first weather.* entity it finds, and (v1.5.4) the first
alarm_control_panel.* entity, whichever brand — its arm/disarm buttons
follow its own supported_features, so a panel that can't do e.g. Night
never shows a button that would just fail. With more than one alarm panel,
config.alarm still lets you pick which; the rest is simply not surfaced yet.
House-mode scene switcher, Energy, Irrigation and Vehicle stay hidden until
you opt into them (see below) — there's no way to guess a "house mode"
script pairing, so those stay off by default rather than guessing wrong.
Configuring the rest
Copy live_dashboard_config.example.js
to one of the paths below — renaming it as you copy it, since the
example file ships inside the plugin's own folder and would be erased by
the next update if edited in place — and uncomment what you need; every key
is documented inline there. Checked in this order, first one found wins:
config/www/live_dashboard_config.js— recommended for every install, HACS or manual. Outside any folder HACS manages, so updates never touch it.config/www/community/live_dashboard/config.js— back-compat for an earlier HACS layout; prefer path 1 above for new installs.config.jsnext topanel.js, inside whichever folder you copiedpublic/into (manual installs only) — back-compat for existing manual installs; still works unchanged, but a HACS update would erase it if used there, so don't use this path once you're on HACS.
Whichever path you use, keep the file out of version control — it holds
your own entity IDs (the provided .gitignore already excludes config.js
under public/; a copy under config/www/ is outside this repo entirely).
Since v1.5.0, config.js is no longer the only way to hide or reorder
what's on screen. The gear icon in the header opens a settings panel
(rooms, entities, cameras, sections) that saves per-user via Home
Assistant's own account storage, so two tablets/phones logged in as the
same person stay in sync without either one touching config.js. The two
never conflict: config.js still has the only say in resolving which
sensor plays which role (production, alarm, appliance status, ...) — the
panel only ever decides what's visible, layered on top. A row the panel
overrides against what config.js says shows a small "differs from
config.js" pill with its own one-tap target to drop the override and go
back to obeying the file. The panel's own "Export as config.js" button
turns your current picks into a paste-ready block for that file, for
anyone who'd rather version their layout or apply it to every user in the
house instead of just their own account.
Since v1.7.0, the Casa home screen's Alarm/Energy/Surveillance cards can
be reordered too — a solar-heavy install can put Energy first, a
camera-heavy one can put Surveillance first. It's one order shared by
desktop (which card fills column 3 first) and mobile (the Casa tab's
stack), not two independent settings, so the wall tablet and your phone
never disagree about what "the current order" is. Settings → Rooms has a
"Home section order" list, with up/down arrows per row and a confirm-gated
reset. config.js's sections.order can set an installation default, same
override hierarchy as rooms.order. This only reorders those three cards
— rooms, the "on now"/quick-actions cards, and desktop's column layout
itself aren't part of it.
Enabling Energy
You may not need to configure anything here at all. If you've already
set up Home Assistant's own Energy dashboard (Settings -> Dashboards ->
Energy) with your solar and grid sensors, this dashboard reads that mapping
automatically and the Fotovoltaico ring just appears. With no Energy
dashboard either, it makes a best-effort guess from any sensor exposing
device_class: energy + state_class: total_increasing with a name that
looks like production/import/export. config.js's energy block, below,
is only for overriding that or filling in what neither source finds —
useful for the instant-power readouts and anything auto-discovery guesses
wrong, but the ring itself often needs none of it.
When you do fill it in, sensors are asked for by role, not by brand, so
it works with anything that exposes these. productionToday / gridToday
/ gridExportToday must be daily counters that reset at midnight — see
TROUBLESHOOTING.md if the numbers look wrong.
| Role | Huawei FusionSolar | SolarEdge | Fronius | Shelly EM | HA Energy Dashboard |
|---|---|---|---|---|---|
production |
sensor.*_panel_production_power |
sensor.solaredge_current_power |
sensor.inverter_power |
sensor.shellyem_channel_a_power |
sensor.solar_power (your own) |
consumption |
sensor.*_house_load_power |
(optional — see below) | (optional — see below) | sensor.shellyem_channel_b_power |
sensor.house_power |
gridImport |
sensor.*_grid_consumption_power |
sensor.solaredge_m1_ac_power (import side) |
sensor.meter_power |
sensor.shellyem_channel_b_power |
your grid import sensor |
gridExport |
sensor.*_grid_injection_power |
same meter, export side | sensor.meter_power (negative) |
same, inverted | your grid export sensor |
productionToday |
sensor.*_panel_production_today |
sensor.solaredge_lifetime_energy (diffed) |
sensor.energy_day |
Shelly EM has no daily counter — add a utility_meter helper |
sensor.solar_energy_today |
gridToday |
sensor.*_grid_consumption_today |
via a utility_meter helper |
sensor.grid_energy_day |
via a utility_meter helper |
sensor.grid_import_today |
gridExportToday |
sensor.*_grid_injection_today |
via a utility_meter helper |
via a utility_meter helper |
via a utility_meter helper |
sensor.grid_export_today |
battery |
sensor.*_battery_soc / _power |
SolarEdge Battery integration | Fronius battery sensors | — | — |
inverterStatus |
sensor.*_inverter_inverter_status |
sensor.solaredge_status |
sensor.status_code |
— | — |
If your integration doesn't expose a daily counter for a given role, add a
utility_meter helper
in Home Assistant that resets daily and point config.js at that instead.
consumptionToday (a whole-house daily consumption counter) has no row
above because none of these integrations expose one directly — it's rare
enough that it's opt-in only, for the odd install that happens to have one
(e.g. from HA's own Energy dashboard "consumption" tracking, if you've
wired that up separately). Set it if you have it; leave it unset otherwise
and the ring derives self-consumption from production and grid export
instead, which is what almost every install ends up doing.
House consumption (instantaneous), derived automatically
Most inverter/meter integrations expose production, grid import and grid
export as live power sensors, but not whole-house consumption — that's the
one role that used to require writing your own template sensor in
configuration.yaml just to add the other three together. You no longer
need to. Leave consumption unset and, whenever production, gridImport
and gridExport are all resolved, this dashboard computes it itself:
house consumption = production + gridImport − gridExport + batteryDischarge − batteryCharge
An explicit consumption sensor, if you set one, always wins — this is only
a fallback for when there isn't one. If any of production/gridImport/
gridExport is missing, the derivation doesn't run at all: you get an honest
"—" rather than a number computed from an incomplete formula. The derived
value declares itself everywhere it appears — "House consumption now ·
calculated" on the instantaneous tile, "kWh calculated" instead of "kWh
consumed" at the center of the ring — so it's never mistaken for a measured
sensor.
If you have a battery: the formula needs to know which sign your battery power sensor uses for charging, since there's no universal convention across integrations.
- Two separate sensors (
config.energy.battery.chargePower/dischargePower, both always positive): no ambiguity, nothing to configure. - One signed sensor (
config.energy.battery.power, the common case): defaults to positive = charging. If that's backwards for your integration, Settings -> Energy has an explicit Battery power toggle — "Positive = charging" / "Positive = discharging" — with the live derived value shown right below it, so you can watch it change as you flip the switch. Get it wrong and the derived consumption comes out implausible (negative) more often than not; when that happens persistently, Settings -> Energy surfaces a warning naming the likely cause with a one-tap fix, and the dashboard shows "—" rather than a negative "house consumption" in the meantime — see TROUBLESHOOTING.md.
The daily kWh figure (the ring, "kWh consumati") had its own, older
derivation already (self-consumption backed out of production and grid
export) — unaffected by any of the above, just now labeled the same way when
it's the one doing the work instead of a consumptionToday sensor.
Instantaneous power unit
Production/consumption/grid-import/grid-export/battery-power tiles read
whatever unit_of_measurement the sensor actually reports (W, kW, or MW —
case-insensitive) and normalize it, so a W sensor and a kW sensor from two
different integrations display consistently instead of one being off by
1000x. Settings -> Energy -> Instantaneous power unit picks how the
normalized number is shown: Auto (under 1000 W shows as W, at or above
shows as kW — the default), or force W / kW always. This only
affects instantaneous power; daily totals (the ring, the bar chart) stay in
kWh regardless.
Reading the ring
The Fotovoltaico ring is two concentric rings, each summing to something real:
- Outer ring = today's house consumption — autoconsumo (self-consumed solar) + prelievo (taken from the grid).
- Inner ring = today's solar production — the same autoconsumo + immissione (fed back to the grid).
Autoconsumo is the number shared by both, which is why it's drawn in the
same color in each ring and both rings start aligned at the top. It's never
a sensor on its own — it's derived as production − gridExport (or, if you
set consumptionToday, as consumption − gridImport, which is preferred
when available since it doesn't assume production and export update in
perfect lockstep).
If you're used to the previous release: earlier versions compared
productionToday against gridToday directly in a single ring — production
vs. grid import, two numbers that were never meant to add up to anything,
so the percentage shown didn't correspond to a real quantity. This ring
replaces that with two totals that each genuinely sum to 100% of
themselves. Expect the numbers to look different, not just restyled.
With only production and gridImport known (no export sensor), the ring
falls back to the old single-ring view rather than showing a wrong or empty
double ring — see TROUBLESHOOTING.md if you expect the new ring and don't
see it.
Enabling Irrigation
Each zone needs only moisture (a sensor.* with % state) and a way to run
water to be useful: sparkline, valve state, and timed-run buttons. Two ways to
wire that second part, pick whichever matches your setup:
valve— aswitch.*this dashboard opens itself, callingswitch.turn_onthenswitch.turn_offafter N minutes. No extra helper entities required.buttons— oneinput_button.*per duration, for setups where a script/automation already owns the timing (e.g. a quick-action automation per duration) and there's no switch to drive directly. Takes over fromvalveif both are set.
Everything else (advisory, deficit, weekMm, lastRun, et0, etc,
effectiveRain, summary) is optional and only appears if you set it.
The agronomic math (ET₀/ETc, accumulated deficit) is not part of this
project — it depends on your own weather station and soil data. The
automations that compute it in the original installation this dashboard was
extracted from are a separate, personal setup and aren't included here;
build your own (any automation that writes the result into an
input_number/sensor and points config.js at it will work), or leave
those fields unset and use the dashboard for live moisture + manual watering
only.
Weather station (optional)
The tappable weather widget (top of Casa, or its own tab on mobile) shows
outdoor temperature/humidity from the weather: entity above by default.
If you have a local weather station, config.weatherStation lets its
sensors take over as the preferred source — usually more accurate and more
local than a forecast provider's current-conditions reading — plus adds
wind, rain, irradiance, ET₀, feels-like, and dew point, none of which a
weather.* entity reliably exposes.
If you've already filled in irrigation.weather (above), temperature,
humidity, wind, rain, irradiance, and ET₀ are reused automatically — you
only need to add feelsLike/dewPoint here, since those have no other
field to live in. Entirely optional; leave it unset and the weather:
entity keeps being the only source, same as before.
Vehicle (optional)
There's no Home Assistant domain that standardizes car telemetry, so
config.vehicle is an explicit field-by-field mapping (fuel or battery,
range, odometer, extra cells, warning binary_sensors). It's been used with a
Mercedes mbapi2020 install; it should work with any integration that
exposes comparable sensors (Volvo, Kia Connect, BMW Connected Drive,
generic OBD-II readers) since nothing here is brand-specific.
Appliances (optional)
Washer, dryer, or anything else where "is it running" matters more than a
plain on/off. No domain standardizes this either, so config.appliances is
an explicit list, each entry matched to a room by resolving its status
entity's own area (same rule as everything else — no separate room field to
fill in).
status— anysensor.*/binary_sensor.*. Its raw state is shown as-is unless you map it throughstateLabels(recommended for a text-state sensor likesensor.washer_state, whose vocabulary is entirely integration-specific — abinary_sensor'son/offreads fine without one).idleStates— which states count as "not running" (defaults tooff/power_off/idle/unavailable/unknown). Override it if your integration uses different words for idle.energyTodayis optional and only shown while idle.powerSwitchis optional and only adds an off button — a switch being "on" isn't treated as "running" (a washer can stay powered between cycles), so it never drives what's shown. If set, that switch also stops being auto-discovered as a plain toggle in its room, since it'd otherwise show up twice.
Appliances that are running also appear in the Casa "on right now" list and in the room summary, the same as lights or a vacuum in progress.
Smart plugs without a config.appliances entry
A generic switch.* entity in a room panel makes the same "is it actually
drawing load" distinction (v1.5.4), with zero configuration: if its device
also exposes a sensor.* with device_class: power (true for most smart
plugs), the relay's on state is read as three levels instead of two —
off, active (relay closed, under the threshold — plugged in but
idle), or running (at/above the threshold, shown with the live wattage).
The threshold defaults to 3 W and is adjustable from Settings → Energia. A
switch with no power sensor on its device is unaffected — plain on/off,
exactly as before.
Cameras (optional)
Fully auto-discovered from every camera.* entity Home Assistant reports —
area from the registry, motion from a binary_sensor with
device_class: motion on the same device. config.cameras only overrides
the defaults (see live_dashboard_config.example.js); there's no per-camera list to
maintain.
- Previews, not video. Each tile shows a still snapshot from
entity_picture(the URL Home Assistant already signs for you), reloaded everysnapshotIntervalseconds (10 by default). The refresh pauses while the browser tab/page isn't visible. - Live on tap, layered by what the camera and browser can actually do
(v1.5.4). Tapping a preview tries, in order, the first one that works:
- A real HLS stream via Home Assistant's
streamintegration, played natively — Safari, iOS, and many iOS webviews only. - The same stream through a vendored
hls.js, if one has been dropped intopublic/vendor/— none ships with this project today, so this layer is currently always inactive; the Diagnostics panel shows which layer is actually in use. - Fast still-image polling (2–3 frames/second) from the same
entity_pictureendpoint the tiles already use, labeled "preview refreshing" instead of "live" — this is what most Android/companion-app users and most RTSP/ONVIF/generic cameras get today, since they don't expose an MJPEG stream (the old/api/camera_proxy_stream/approach) and Android has no native HLS. It's not a smooth live feed, but it moves, on any camera, on any platform, with no dependencies. Only runs while the detail view is open, and pauses with the tab/page. The detail view closes automatically after 2 minutes, or on tap.
- A real HLS stream via Home Assistant's
- Privacy for indoor cameras: list an entity_id in
hideUntilTapand its tile shows only an icon — no preview loads — until someone taps it once to reveal the still, and taps again to go live. Meant for a camera pointed at a hallway where the tablet itself lives. - The "Sorveglianza"/"Surveillance" tab only appears with 2 or more
cameras — with exactly one, the Casa card and its tap-to-fullscreen
overlay are already the whole feature, a tab with one tile wouldn't add
anything. Above
gridTabcameras (6 by default) the tab's grid switches from 2 to 3 columns. - This only works over
panel_custom(see "What this is, and isn't" above): the snapshot/stream URLs are HA-signed and same-origin with the panel, which is exactly what a future standalone/token variant would need to handle differently.
Kiosk mode for the wall tablet
Point Fully Kiosk Browser (or any kiosk
browser) at https://<your-ha>/casa. To hide the Home Assistant sidebar and
header on top of the panel, use
kiosk-mode from HACS, or Fully
Kiosk's own "Web Content Zoom"/immersive settings. Target resolution
1280×800 landscape — anything narrower or shorter than that switches the
Casa view into a scrolling layout (deliberately — see TROUBLESHOOTING.md).
Demo mode
Open the page with ?demo appended to the URL (or just open it directly
outside of panel_custom — from file://, the dashboard has no host to
talk to and falls back to the same demo backend automatically after a short
timeout). It shows every view — Casa, Sorveglianza, Irrigazione, Energia,
Auto — with invented data and a visible DEMO badge, and never calls a real
service. The demo cameras show only their icon placeholder (there's no real
feed to fake), including one flagged hideUntilTap so you can see that
behavior too.
Known limits
- The result is only as good as your area assignments. Every room,
device and camera on this dashboard comes from Home Assistant's own
area/device/entity registries — there's no fallback naming or grouping
logic beyond that. If your installation has areas assigned consistently,
it looks sensible the moment you open it, no config required. If you've
never assigned areas — everything still lives under "no area" the way a
fresh install often does — the dashboard will look almost empty, and
that's not a bug to report: it's Home Assistant's own
Settings -> Areaswaiting to be filled in, not something this dashboard can guess for you. - Rooms show what you'd act on or ask about out loud, not every entity in
the area. Discovered domains:
light,switch,cover,media_player,climate,fan,vacuum,humidifier,lock,water_heater,valve,lawn_mower,siren. Sensor pills:temperature,humidity,illuminance,carbon_dioxide,pm25, andbattery(only under 20% — a charged battery isn't news), plus door/window/opening/garage_door, motion/occupancy/presence and moisture/smoke/gasbinary_sensorpills, shown only while they're actually "on" — a closed window is the normal state.voltage,current,energyand other power-metering sensors are deliberately never shown as pills or rows; a switch's own device wattage shows inline in its room-panel row instead, when adevice_class: powersensor exists on the same device. - Built for a landscape wall tablet first; the mobile page is complete but secondary, not the primary design target.
- Not a Lovelace replacement — no card picker, no drag-and-drop layout, no YAML dashboard config. It's one page that reflects your registries.
- The settings panel (gear icon, v1.5.0) hides, shows and reorders what auto-discovery already found — it doesn't compose a layout from scratch. Specifically not in it: free repositioning of cards, choosing which column a room lands in, a theme/color editor, or creating new views. Lovelace already does all of that, and is the right tool when that's what you want.
panel_customis the only supported install method in this release — see CHANGELOG.md.
More
- Before opening an issue, open Settings → Diagnostica in the app itself and paste what it shows — it names the config path that loaded (or didn't), what each energy sensor resolved to, and why, without needing the browser console. A "Copy diagnostics" button puts all of it on the clipboard.
- TROUBLESHOOTING.md — white panel, empty rooms, wrong charts, missing alarm buttons.
- CHANGELOG.md
- live_dashboard_config.example.js — every override, documented inline.
Comments