
Single-binary observability, time-series storage, and built-in dashboards for Raspberry Pi, edge devices, appliances, and local metrics.
Ingest metrics, query history, explore series, edit dashboards in the browser,
and inspect data offline with nanocli without assembling a separate TSDB,
dashboard service, or support stack.
Designed for the cases where a bigger observability stack is heavier than the problem: one machine, local files, clear operational behavior, and a UI that is ready as soon as the binary starts.
One binary. Local files. Built-in dashboard and editor. Offline CLI.
Get Started Fast
- Start
nanotdbagainst a local data directory. - Send line protocol directly or collect host metrics with
drip. - Open the built-in dashboard or Explore to see live metrics immediately.
- Use the in-browser editor or
nanocliwhen you want to shape dashboards or inspect data offline.
Typical Workflow
Run drip on a Raspberry Pi or small Linux box to collect host metrics, store
them locally in NanoTDB, inspect them live in the built-in dashboard or
Explore, and use nanocli when you need offline inspection, export, recovery,
or rollup operations.
Sample Footprint
Actual live Raspberry Pi data:
- 84 metrics collected every 10 seconds
- About 700,000 samples per day
| Day | Metrics | Points | Metric file size | Coverage |
|---|---|---|---|---|
| 2026-05-22 | 83 | 693,091 | 757 KB | 24h |
| 2026-05-23 | 83 | 717,036 | 935 KB | 24h |
Product Tour
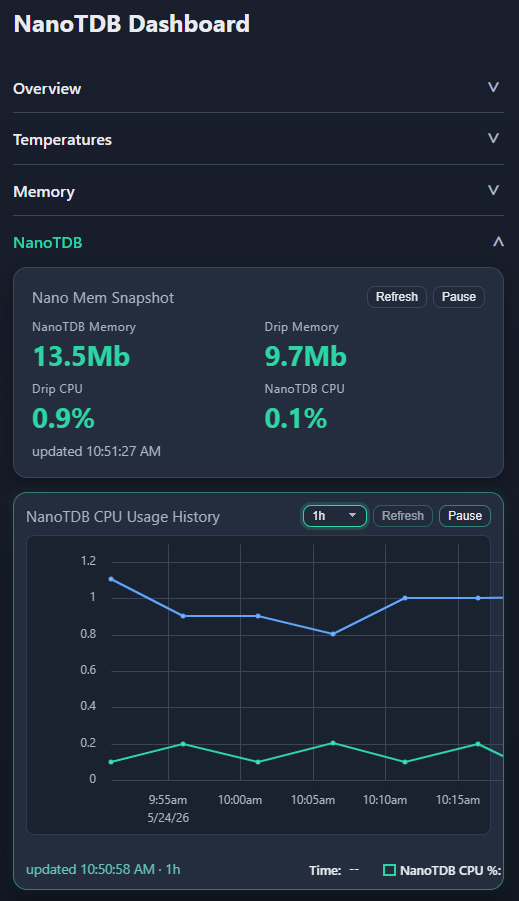
- Dashboard: mobile-friendly live CPU, memory, disk, and sensor-style widgets from one local NanoTDB instance.
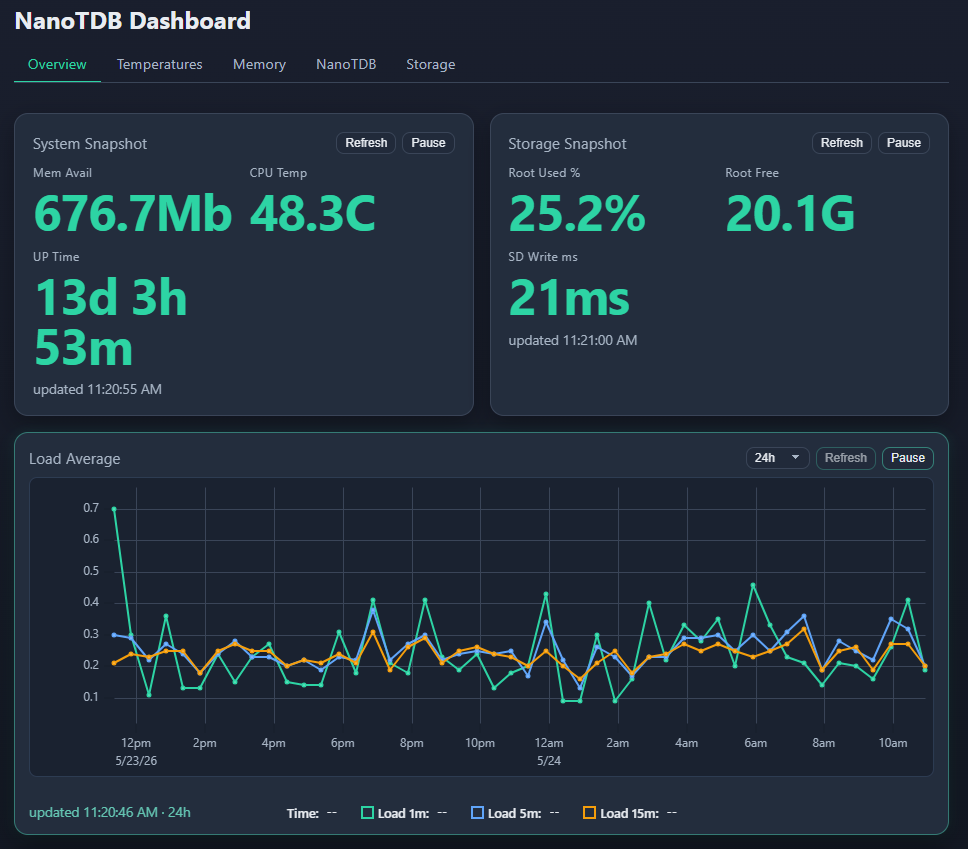
- Dashboard Wide: a wider desktop dashboard layout for broader operational views on larger screens.
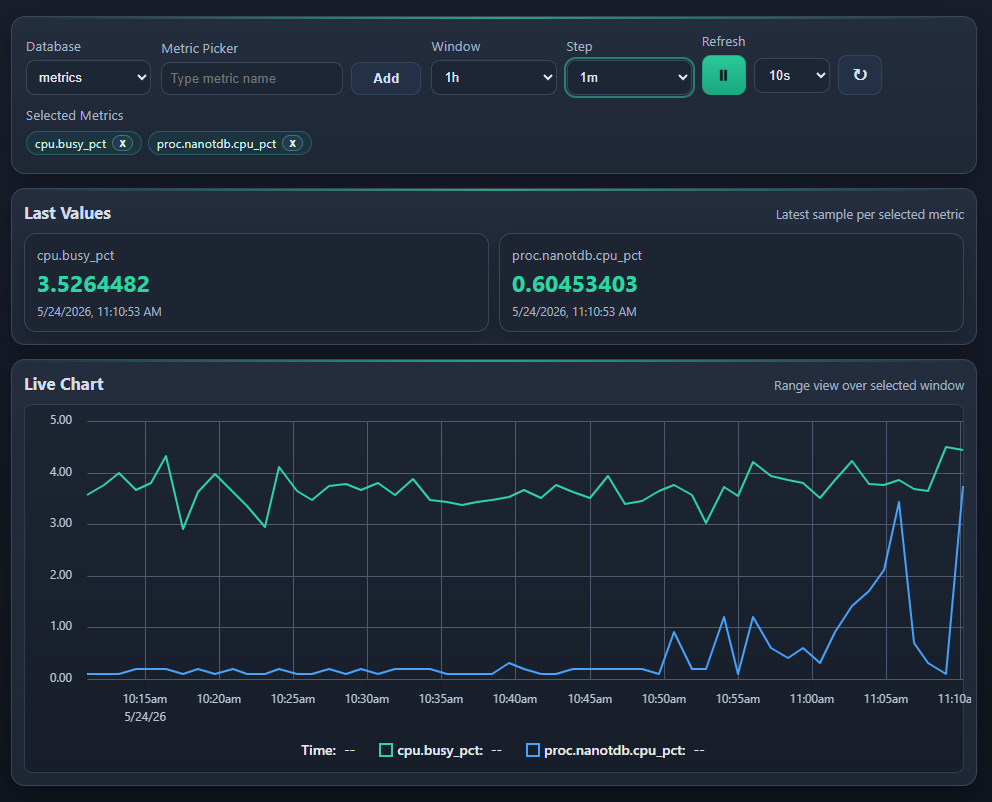
- Explore: ad hoc metric selection with a live chart and last-value cards for long metric names and quick drill-down.
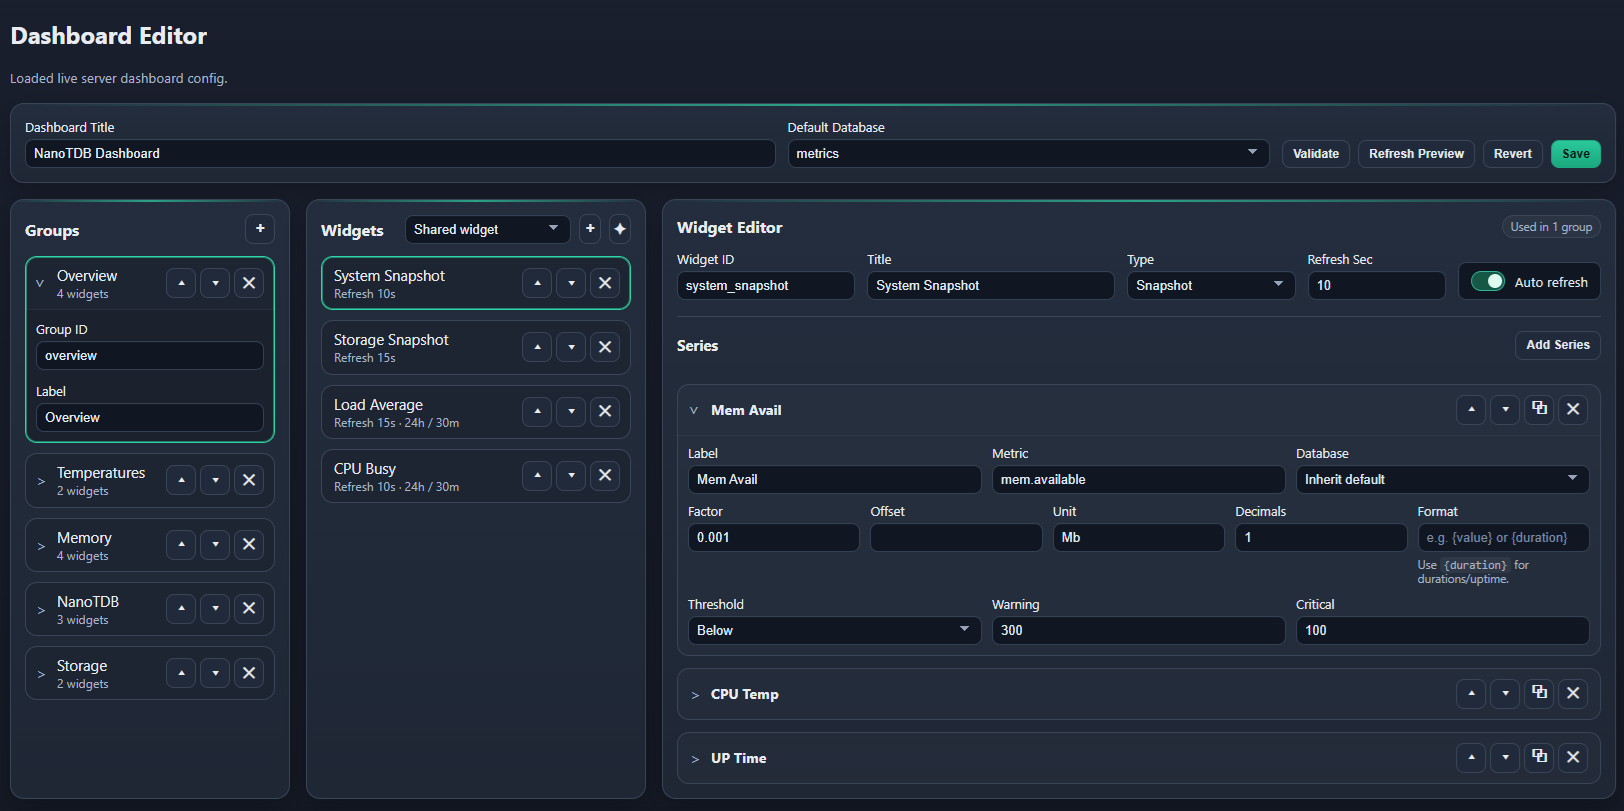
- Dashboard Editor: in-browser editing for groups, widgets, series, preview, validation, and save.
Everything In One Binary
- Metric ingest API for local applications, devices, and collectors.
- Built-in dashboard for live operational views on both mobile-width and desktop-width layouts.
- Built-in dashboard editor for in-browser dashboard authoring.
- Explore view for ad hoc metric lookup and charting.
- Engine inspector for operational state, files, runtime, and settings.
- Offline CLI tools for inspect, export, import, recover, and rollup workflows.
- Rollups and query-optimized metric files without adding separate services.
When Simpler Wins
| Question | NanoTDB | Bigger stack |
|---|---|---|
| Single Raspberry Pi or edge box? | One binary, local files, built-in dashboard | Usually multiple services and more moving parts |
| Need local observability first? | Storage, UI, CLI, and rollups are already together | Often starts with separate TSDB + dashboard + supporting services |
| Want to inspect everything on disk? | WAL, manifests, catalog, and data files stay understandable | More layers and components between writes and storage |
| Need huge fleet-scale cardinality? | Not the target | Usually the better fit |
Why Teams Pick It
- One deployable binary: ingest, query, dashboard, Explore, editor, and local operations ship together.
- Fast path to visibility: start writing metrics and open a usable dashboard immediately instead of assembling a separate stack first.
- Built for small systems: a strong fit for Raspberry Pi, edge nodes, appliances, and local application metrics.
- Files you can inspect: WAL, catalog, manifests, raw partitions, and metric files stay understandable on disk.
- Offline by default:
nanoclilets you inspect, export, recover, and compare data without a running server. - Read-optimized when needed: optional metric files and built-in rollups improve read paths without adding extra services.
- Operationally boring: no runtime dependency chain, no separate dashboard service, and retention maps cleanly to file deletion.
Best For
| Good fit | Use something larger |
|---|---|
| Single-binary observability on one machine | Distributed or horizontally scaled deployments |
| Raspberry Pi, edge nodes, appliances, and local app metrics | Large fleets and high-cardinality multi-tenant workloads |
| Hundreds of metrics you want to keep local and inspect directly | Broader ecosystems where many external integrations matter more than simplicity |
| Built-in dashboard plus offline CLI workflow | Systems that need looser ordering guarantees or broader platform features |
NanoTDB fits best when you want:
- Single-binary observability on one machine.
- Local metrics storage with a built-in dashboard.
- Something you can understand from the filesystem.
- A TSDB for hundreds of metrics, not huge multi-tenant cardinality.
- A small self-hosted stack for sensors, host telemetry, appliances, or embedded apps.
Not Built For
NanoTDB is not trying to be:
- A distributed or horizontally scaled TSDB.
- A high-cardinality metrics backend for large fleets.
- A system that accepts arbitrary out-of-order writes.
- A system that hides its durability tradeoffs behind marketing language.
Common Uses
Raspberry Pi and edge host telemetry
NanoTDB is a strong fit for small Linux systems where you want to keep metrics
local, survive restart, and avoid wearing out SD storage with unnecessarily
heavy write patterns. Pair it with drip when you want CPU, memory, disk, IO,
network, load, one-wire, or SD write probe metrics on one box, then view them
through the built-in dashboard without standing up a second service.
Local app metrics without a bigger stack
If you have one appliance, one embedded app, or one self-hosted node, NanoTDB gives you metric writes, queries, rollups, dashboarding, and offline inspection without standing up a larger metrics platform just to answer simple history questions.
Sensor retention you can inspect directly
If your data is fundamentally numeric time-series data, NanoTDB is often easier
to live with than plain logs. You keep a queryable history, can inspect the WAL
or .dat files directly with nanocli, and can delete old partitions as a
simple retention policy.
Long-horizon summaries on small disks
When you want recent raw detail plus longer-term summaries, NanoTDB's built-in rollups let you keep local aggregates without building a separate compaction or downsampling pipeline.
🚀 Quick Start
Start here:
- Hello World for the fastest copy/paste path.
- Getting Started for installation, examples, and a longer guided tour.
- Dashboard for the built-in UI, dashboard.json, and dashboard/editor workflow.
- Metric Files for query-optimized metric storage, config, inspection, and standalone benchmarking.
- Run As A Service for a brief systemd setup path.
- Glossary for the canonical meaning of database, metric, sample, WAL, and related terms.
- Contributing for the branch model and release workflow.
60-Second Hello World
Terminal 1:
mkdir -p ~/nanotdb-data
./nanotdb --init --config ~/nanotdb-data/engine.toml
./nanotdb --config ~/nanotdb-data/engine.toml
Terminal 2:
curl -X POST "http://localhost:8428/api/v1/import" \
  -d $'demo/room.temp 21.5\ndemo/room.humidity 48'

curl "http://localhost:8428/api/v1/query?query=demo/room.temp"

./nanocli inspect wal --root ~/nanotdb-data --db demo --verbose
That flow is the point of NanoTDB: start one binary, write a few metrics, query them back, inspect the local files, and serve a local dashboard without standing up anything else.
For the built-in browser UI and dashboard customization, see docs/DASHBOARD.md.
Prefer ready-to-use binaries? Download the latest release assets from GitHub Releases:
- Old Raspberry Pi (Pi 0/1):
nanotdb-linux-armv6-rpi0-rpi1andnanocli-linux-armv6-rpi0-rpi1 - Newer 32-bit Raspberry Pi OS (Pi 2/3/4):
nanotdb-linux-armv7-rpi3-rpi4andnanocli-linux-armv7-rpi3-rpi4 - 64-bit Raspberry Pi OS:
nanotdb-linux-arm64andnanocli-linux-arm64
Release/change history:
- Published release notes and downloads: Releases
- Detailed change log in-repo: CHANGELOG.md
For technical deep-dives, continue below.
Core Concepts
What is a database?
A database in NanoTDB is an isolated local namespace such as prod, sensors,
or weather.
Each database has its own:
- metrics
- WAL file
- catalog
- manifest
- partitioned
.datfiles
That makes it easy to reason about retention, inspection, backup, and failure isolation one database at a time.
What is a metric?
A metric is one numeric time-ordered stream inside a database.
Examples:
room.temproom.humiditycpu.usage_activedisk.sd_write_probe_ms
Each metric keeps one numeric type for its lifetime: int32 or float32.
What does a sample look like?
NanoTDB writes and reads line protocol in this shape:
DB/metric.name value [timestamp]
Examples:
prod/room.temp 21.5 1715000000000000000
sensors/pressure.hpa 1013
weather/outdoor.humidity 48
DBis the database name.metric.nameis the metric identifier.valueis an integer or float.timestampis optional; if omitted, NanoTDB uses the current time.
For a deeper storage and query walkthrough, see docs/ARCHITECTURE.md.
What is the WAL?
WAL means write-ahead log.
In NanoTDB, each database has a local <db>.wal file that protects the newest
samples before they are flushed into durable .dat pages.
That matters for both crashes and normal shutdown:
- On clean shutdown, NanoTDB flushes open pages before exit so recent samples move into durable data files.
- On restart after a crash or power loss, NanoTDB replays the WAL so unflushed samples can be recovered into the in-memory open page state.
- Once a page is flushed and no open page still depends on that WAL content, the WAL can be reset.
This is one of NanoTDB's strongest operational properties for edge systems: the latest data is not only local, it is recoverable after restart without needing an external service.
How WAL and recovery can be tuned
The main WAL and durability knobs are in engine.toml and per-database
manifests:
wal.max_segment_size: how large the WAL is allowed to grow before reset after flush.wal.fsync_policy:segmentfor better throughput,alwaysfor stronger per-append durability.durability.profile:strict,balanced, orthroughputfor page/catalog fsync behavior.manifest_defaults.wal.enabled: enable or disable WAL for newly created databases.manifest_defaults.wal.skip_before: skip WAL for older backfill samples.manifest_defaults.page.max_records,max_bytes, andmax_age: control how quickly in-memory pages roll over and flush, which affects how long data remains WAL-backed before landing in.datfiles.
If you want the strongest local recovery posture, the conservative end of the range is:
wal.fsync_policy = "always"durability.profile = "strict"
If you want less write overhead and can tolerate more crash risk, move toward
segment and balanced or throughput.
Why the data files matter
NanoTDB's durable .dat files are small, append-only, and friendly to simple
retention and backup workflows.
That matters operationally, especially on SD-backed systems:
- small files are easier to inspect and copy
- retention is just removing old partition files
- append-only writes are easier on flash media than rewrite-heavy designs
- compressed page files keep local history practical on small disks
As one real Pi test point, a 69-metric workload sampled every 10 seconds
produced about 0.7 MB for a full day in one .dat file, which worked out to
under 2 bytes per metric point on disk after compression. Treat that as a
real-world example, not a universal promise, but it shows why NanoTDB can be a
very SD-friendly fit for local telemetry.
Why not plain logs?
Plain logs are often enough until you want to ask metric-shaped questions like:
- what was the last temperature?
- show me the last 24 hours of humidity
- downsample this series for a dashboard
- inspect the local data without shipping it anywhere else
You can force numeric history into logs, but querying, retention, aggregation, and inspection stay awkward. NanoTDB keeps the operational simplicity of local files while giving you metric-native writes, queries, rollups, and offline inspection.
Why not a heavier TSDB?
Sometimes a larger metrics stack is the right answer. NanoTDB is for the cases where it is not.
Choose NanoTDB when you want:
- one local node instead of a broader platform
- plain files you can inspect and back up directly
- hundreds of metrics, not massive fleet-scale cardinality
- built-in local rollups without extra components
Choose a larger TSDB when you need:
- very large scale or high-cardinality workloads
- distributed storage and query execution
- looser write-ordering expectations
- a broader ecosystem of integrations than a small local stack needs
Configuration (engine.toml)
Created automatically at <root>/engine.toml on first start. Key settings:
| Key | Default | Effect |
|---|---|---|
engine.listen |
:8428 |
HTTP server address |
wal.max_segment_size |
67108864 (64 MiB) |
WAL size before reset after a page flush |
wal.fsync_policy |
segment |
segment = fsync on WAL reset; always = fsync every append |
durability.profile |
strict |
strict / balanced / throughput (see below) |
stats.enabled |
true |
Emit engine self-metrics to the internal database |
stats.interval |
30s |
How often stats are flushed |
Logging (engine.toml)
Engine and server logging are configured under [logging] with one or more [[logging.logger]] entries.
Example:
[logging]

[[logging.logger]]
output = "console"
level = "info"

[[logging.logger]]
output = "/var/log/nanotdb/debug.log"
level = "debug"
Logging rules:
output = "console"writes to stderr.- Any other
outputvalue is treated as a file path and opened in append/create mode. levelcan beinfo,debug, ortrace.- Multiple logger entries are allowed, so you can keep sparse operator-facing console logs and more detailed file logs at the same time.
Level guidance:
info: startup, shutdown, database open/replay, backfill begin/end.debug: page flushes, WAL resets, rollup trigger boundaries, file lifecycle details.trace: per-sample ingest flow, new metric creation, stale/out-of-order rejection, HTTP request summaries.
Durability profiles:
| Profile | Page file fsync | Catalog fsync |
|---|---|---|
strict |
yes | yes |
balanced |
yes | no |
throughput |
no | no |
Per-database settings (retention, partitioning, WAL skip window, page flush thresholds, rollups) live in
<db>/manifest.toml and default values can be set in engine.toml under
[manifest_defaults].
Partition options in [retention]:
partition = "day"(default):data-YYYY-MM-DD.datpartition = "month":data-YYYY-MM.datpartition = "year":data-YYYY.datpartition = "forever":data-forever.dat
Rollups (manifest.toml)
Rollup jobs are defined in the source database manifest under [rollups].
Example:
[rollups]
enabled = true
checkpoint_file = "rollup.checkpoints.log"
default_grace = "5m"
default_interval = "1h"
default_destination_db = "sensors_rollup_1h"
default_aggregates = ["min", "max", "avg", "count"]
global_exclude_patterns = ["nanotdb.*", "*.debug"]

[[rollups.jobs]]
id = "all_metrics_1h"
source_pattern = "*"
exclude_patterns = ["disk.sd_write_probe_ms", "net.*"]

[[rollups.jobs]]
id = "outside_temp_1h"
source_metric = "temp.out_dry"
interval = "1h"
aggregates = ["min", "max", "sum", "avg", "count"]
destination_db = "sensors_rollup_1h"
destination_metric_prefix = "temp.out_dry"
Rollup config reference:
| Field | Scope | Required | Valid / Default | Notes |
|---|---|---|---|---|
rollups.enabled |
DB | no | `true | false(defaultfalse`) |
rollups.checkpoint_file |
DB | no | string (default rollup.checkpoints.log) |
Checkpoint log path, relative to source DB directory. |
rollups.default_grace |
DB | no | Go duration or empty | Used when job grace is omitted. |
rollups.default_interval |
DB | no | Go duration or empty | Used when job interval is omitted. |
rollups.default_destination_db |
DB | no | string or empty | Used when job destination_db is omitted. |
rollups.default_aggregates |
DB | no | subset of `min | max |
rollups.global_exclude_patterns |
DB | no | wildcard list | Excluded from selector-based jobs before expansion. |
rollups.jobs[].id |
Job | yes | non-empty string | Unique per source DB for checkpoint tracking. |
rollups.jobs[].source_metric |
Job | yes* | non-empty string | Exact metric to read from source DB. |
rollups.jobs[].source_pattern |
Job | yes* | wildcard pattern supporting * |
Selector-based job that expands to concrete metrics. |
rollups.jobs[].exclude_patterns |
Job | no | wildcard list | Additional per-job exclusions for selector-based jobs. |
rollups.jobs[].interval |
Job | no | valid Go duration (>0) |
Rollup bucket size; may inherit rollups.default_interval. |
rollups.jobs[].aggregates |
Job | no | `min | max |
rollups.jobs[].destination_db |
Job | no | non-empty string | Target DB; may inherit rollups.default_destination_db. |
rollups.jobs[].destination_metric_prefix |
Job | no | string (default source_metric) |
Output names are <prefix>.<agg>. |
rollups.jobs[].grace |
Job | no | Go duration or empty | Overrides default_grace for this job. |
Notes:
- Each job must set exactly one of
source_metricorsource_pattern. - Checkpoints are stored in the source DB (default
rollup.checkpoints.log). - Selector-based jobs expand to deterministic checkpoint keys:
<job-id>::<metric-name>. - Destination DBs can also define their own rollup jobs to create cascades (for example
1h -> 1d). - Auto-created rollup destination DBs are written with rollup-tuned manifests: WAL disabled,
partition = "month"for sub-daily rollups or"year"for daily-or-larger rollups, and a longerpage.max_ageto reduce tiny sparse pages.
Backfill helpers:
nanocli rollup --root <dir> [--db <source-db>] [--json]resets rebuildable rollup destination state and recomputes rollups offline.POST /api/v1/rollup/backfillruns the same engine-owned workflow inside a runningnanotdbserver.- Online backfill persists rebuilt destination
.datpages andcatalog.jsonbefore returning, so offlinenanocli inspect/exportcan read the rebuilt DB immediately.
nanocli inspection helpers
For deeper file inspection, use the dedicated DAT/WAL inspect commands:
./nanocli inspect dat --root ./devdata --db internal --verbose
./nanocli inspect wal --root ./devdata --db internal --verbose
Terminal output uses aligned tables. Verbose DAT output shows per-page size/compression stats; WAL verbose output adds tail diagnostics. Human-readable output shows start plus duration; --json retains the full machine-readable timestamps.
Binaries
nanotdb — server
nanotdb --config <path>      start server using given engine.toml
nanotdb --init --config <path>   write default engine.toml and exit
Exposes a small HTTP API compatible with the VictoriaMetrics instant/range query
wire format (/api/v1/import, /api/v1/import/prometheus, /api/v1/query, /api/v1/query_range).
API quick reference:
GET /health- health checkPOST /api/v1/import- import line protocol (raw body or JSON payload)POST /api/v1/import/prometheus- Prometheus-compatible import endpointGET /api/v1/query- instant query (latest point)GET /api/v1/query_range- range query
Also exposes discovery endpoints:
GET /api/v1/databases(use?include_internal=trueto include the internal DB)GET /api/v1/metrics?db=<name>(use&details=truefor id/type metadata)POST /api/v1/rollup/backfill(optional JSON body:{"source_db":"name"}or{"source_dbs":[...]})
nanocli — offline CLI tool
Operates directly on the data directory without a running server.
nanocli inspect db  --root <dir> --db <name> [--verbose] [--json]  — database overview + optional detailed DAT/WAL tables
nanocli inspect dat --root <dir> --db <name> [--verbose] [--json]  — .dat file/page inspection tables
nanocli inspect wal --root <dir> --db <name> [--verbose] [--json]  — WAL inspection tables + optional tail diagnostics

nanocli import --root <dir> --in <file.lp>  [--json]     — bulk import line-protocol file
nanocli rollup --root <dir> [--db <source-db>] [--json]  — reset and recompute rollup destinations from source manifests
nanocli export --root <dir> --db <name> [--out <file.lp>] — export database to line protocol (stdout when --out is omitted)
nanocli build metric --root <dir> --db <name> [--part <partition>] [--format <v2|v1>] [--codec <name>] [--raw-ingest-action <keep|rename|delete>] [--verify] [--json]

nanocli query  --root <dir> --db <name> --metric <regex>
               [--start <time>] [--end <time>] [--aggregate <list> --window <duration>]
               [--metric-files <config|on|off>] [--format table|json]
LP timestamps (import and exported files) accept / use: YYYY-MM-DD HH:MM:SS.nnnnnnnnn (UTC)
and also accept raw Unix nanoseconds on import.
--start / --end accept RFC3339 strings, YYYY-MM-DD [HH[:MM[:SS[.nnnnnnnnn]]]],
or Unix timestamps (seconds or nanoseconds).
Aggregate query notes:
- supported aggregates are
min,max,sum,avg, andcount - aggregate queries require both
--aggregateand--window - aggregate queries require
--start;--endis optional and defaults to open-ended - aggregate queries must match exactly one metric after regex expansion
- aggregate rows are emitted at bucket end timestamps; the first and last bucket are clipped to the requested range
Examples:
nanocli build metric --root ~/nanotdb-data --db sensors --verify

nanocli query --root ~/nanotdb-data --db sensors --metric '^temp\.out_dry$' \
  --start 2026-05-24T12:00:00Z --end 2026-05-24T13:00:00Z \
  --aggregate min,max,sum,avg,count --window 5m --format table

nanocli query --root ~/nanotdb-data --db sensors --metric '^temp\.out_dry$' \
  --start 2026-05-24T12:00:00Z --aggregate sum,count --window 5m --json
drip — metrics collector
drip is an optional host metrics collector intended for small edge systems such as Raspberry Pi.
It gathers CPU, memory, disk, IO, network, load average, one-wire temperature, and SD write probe metrics and POSTs them to NanoTDB using line protocol.
Rollup full-cycle check script
For deterministic end-to-end verification (generate LP -> import -> rollups -> export -> compare expected), run:
./scripts/rollup_full_cycle_check.sh
Optional arguments:
./scripts/rollup_full_cycle_check.sh <root-dir> <duration-hours> <metrics> <cadence-seconds> <gap-metrics>- Defaults:
root-dir=test-data/full-cycle-check,duration-hours=30,metrics=10,cadence-seconds=10,gap-metrics=2
Generated artifacts are placed in <root-dir>/work for easy discovery:
scenario_summary.json(duration, rates, counts, per-metric stats)known_gaps.csv(deterministic missing windows fortemp.gap_probeXXmetrics)SCENARIO.md(quick human-readable summary)
Engine API (embedding)
e, err := engine.OpenEngine("/data", 0)   // 0 = default WAL segment size
defer e.Close()

// Ingest
err = e.AddLine("sensors/temp 22.1 " + strconv.FormatInt(time.Now().UnixNano(), 10))

// Range query
err = e.QueryRange("sensors", "temp", fromTS, toTS, 1, func(s engine.Sample) error {
    fmt.Println(s.TS, s.Float32)
    return nil
})

// Last value (from in-memory catalog cache)
sample, ok, err := e.QueryLast("sensors", "temp")

// Bulk import / export
err = e.ImportFile("backup.lp")
err = e.ExportFile("sensors", "backup.lp")
Key types:
| Type | Description |
|---|---|
Engine |
Top-level coordinator; safe for concurrent use |
Database |
One named DB with WAL + catalog + data files |
Catalog |
Metric name ↔ ID registry; persisted as JSON |
Page |
In-memory buffer of interleaved samples; flushed when full |
WAL |
Single-file write-ahead log with compact v2 encoding |
Sample |
Decoded data point from a query |
Timestamp |
int64 Unix nanoseconds |
MetricID |
uint16 per-database metric address |
Comments